Prologue
I should have written this post like a decade ago, but laziness got the better of me.
I use TLS with IMAP and SMTP mail server. That means I encrypt the connection by protocol against the mail server and not by port (ssl Vs tls). Although I do not accept any authentication before STARTTLS command is being provided (that means no cleartext passwords in authentication), I was leaving the PLAIN TEXT authentication mechanism in the configuration. That’s not an actual problem unless you are already on the server and you are trying to connect on localhost but I can do better.
LDAP
I use OpenLDAP as my backend authentication database. Before all, the ldap attribute password must be changed from cleartext to CRAM-MD5
Typing the doveadm command from dovecot with the password method:
# doveadm pw
Enter new password:    test
Retype new password:   test
{CRAM-MD5}e02d374fde0dc75a17a557039a3a5338c7743304777dccd376f332bee68d2cf6
will return the CRAM-MD5 hash of our password (test)
Then we need to edit our DN (distinguished name) with ldapvi:
From:
uid=USERNAME,ou=People,dc=example,dc=org
userPassword: test
To:
uid=USERNAME,ou=People,dc=example,dc=org
userPassword: {CRAM-MD5}e02d374fde0dc75a17a557039a3a5338c7743304777dccd376f332bee68d2cf6
Dovecot
Dovecot is not only the imap server but also the “Simple Authentication and Security Layer” aka SASL service. That means that imap & smtp are speaking with dovecot for authentication and dovecot uses ldap as the backend. To change AUTH=PLAIN to cram-md5 we need to do the below change:
file: 10-auth.conf
From:
auth_mechanisms = plain
To:
auth_mechanisms = cram-md5Before restarting dovecot, we need to make one more change. This step took me a couple hours to figure it out! On our dovecot-ldap.conf.ext configuration file, we need to tell dovecot NOT to bind to ldap for authentication but let dovecot to handle the authentication process itself:
From:
# Enable Authentication Binds
# auth_bind = yes
To:
# Enable Authentication Binds
auth_bind = no
To guarantee that the entire connection is protected by TLS encryption, change in 10-ssl.conf the below setting:
From:
ssl = yesTo:
ssl = requiredSSL/TLS is always required, even if non-plaintext authentication mechanisms are used. Any attempt to authenticate before SSL/TLS is enabled will cause an authentication failure.
After that, restart your dovecot instance.
Testing
# telnet example.org imap
Trying 172.12.13.14 ...
Connected to example.org.
Escape character is '^]'.
* OK [CAPABILITY IMAP4rev1 LITERAL+ SASL-IR LOGIN-REFERRALS ID ENABLE IDLE STARTTLS AUTH=CRAM-MD5] Dovecot ready.

1 LOGIN USERNAME@example.org test

1 NO [ALERT] Unsupported authentication mechanism.
^]
telnet> clo
That meas no cleartext authentication is permitted
MUA
Now the hard part, the mail clients:
RainLoop
My default webmail client since v1.10.1.123 supports CRAM-MD5
To verify that, open your application.ini file under your data folder and search for something like that:
    imap_use_auth_plain = On
    imap_use_auth_cram_md5 = On
    smtp_use_auth_plain = On
    smtp_use_auth_cram_md5 = On
as a bonus, rainloop supports STARTTLS and authentication for imap & smtp, even when talking to 127.0.0.1
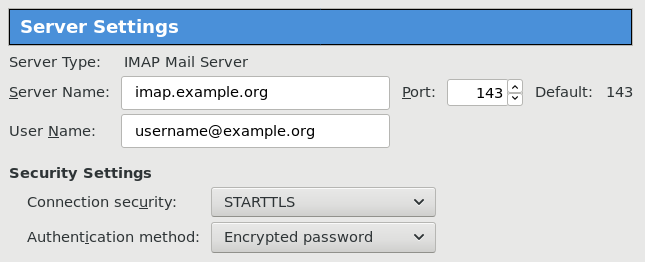
Thunderbird
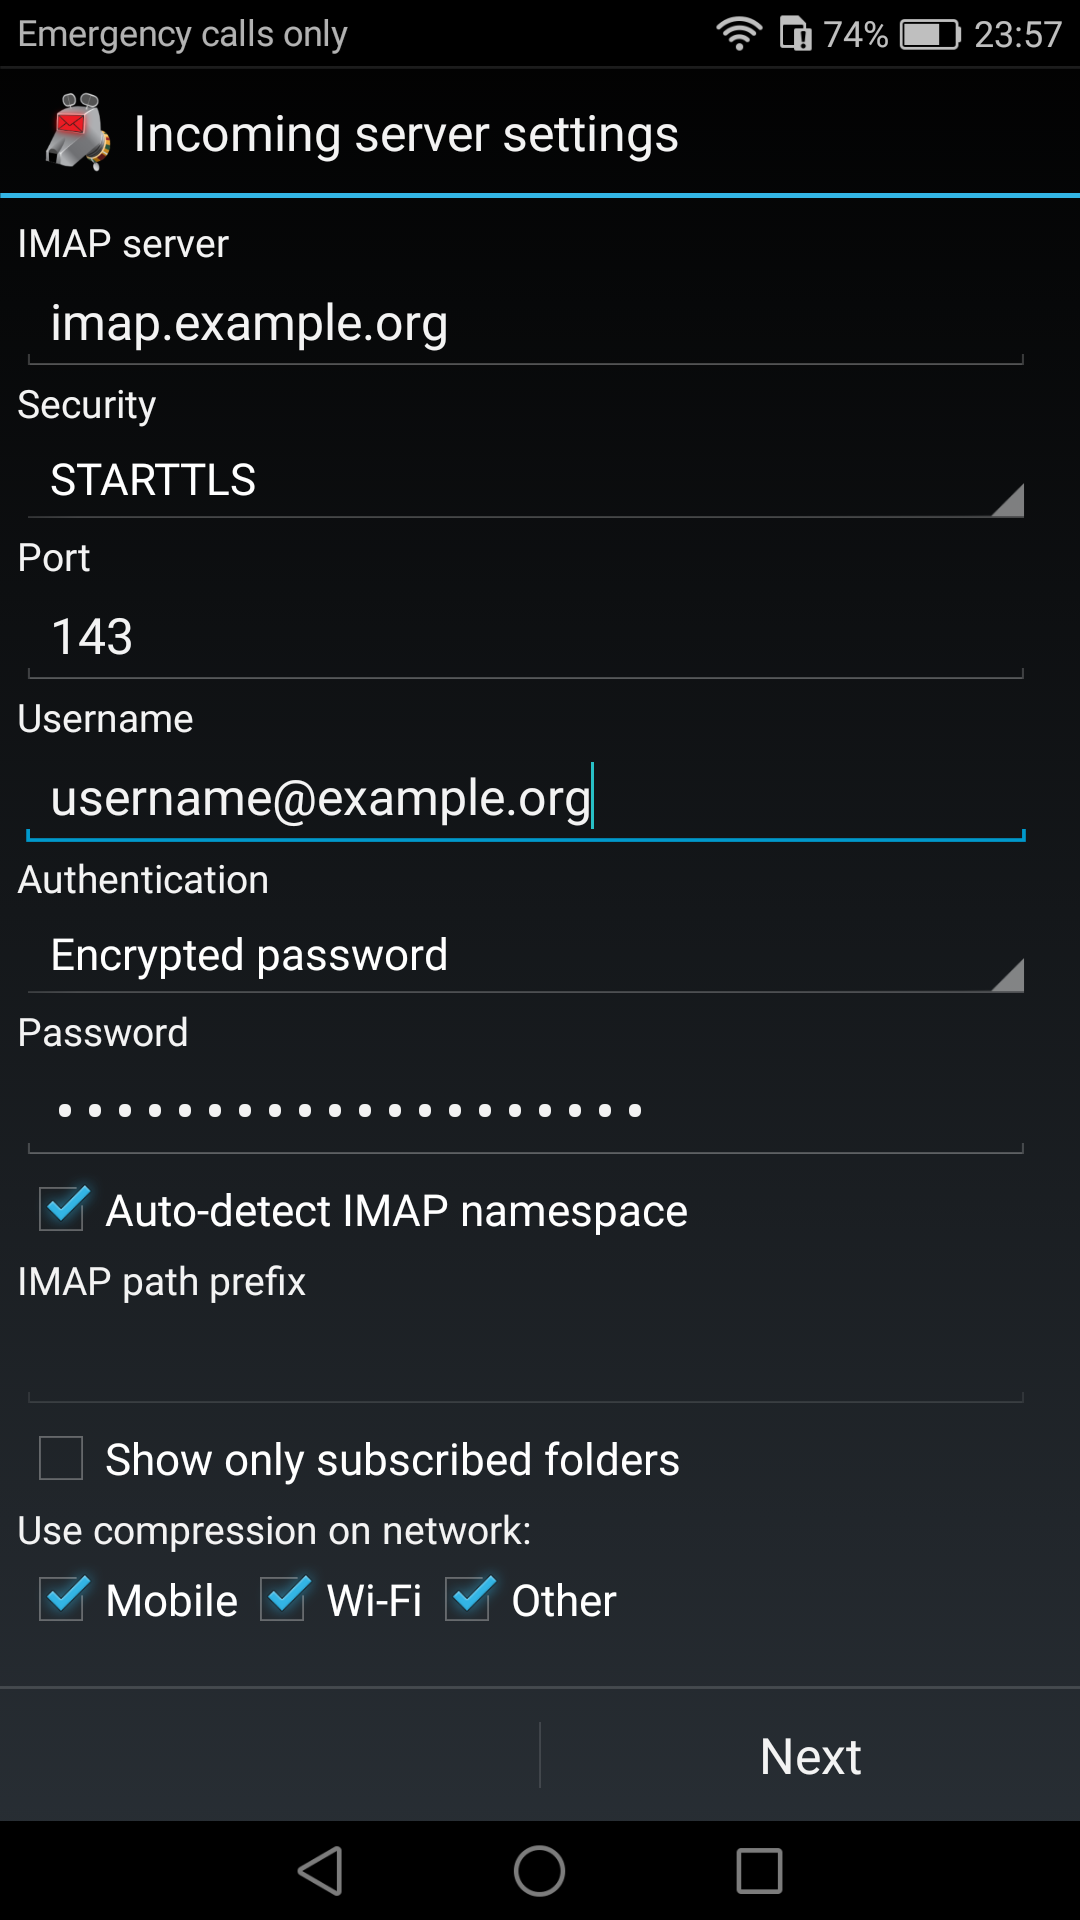
K9
When traveling, I make an effort to visit the local hackerspace. I understand that this is not normal behavior for many people, but for us (free / opensource advocates) is always a must.
This was my 4th week on Bratislava and for the first time, I had a couple free hours to visit ProgressBar HackerSpace.
For now, they are allocated in the middle of the historical city on the 2nd floor. The entrance is on a covered walkway (gallery) between two buildings. There is a bell to ring and automated (when members are already inside) the door is wide open for any visitor. No need to wait or explain why you are there!
Entering ProgressBar there is no doubt that you are entering a hackerspace.

You can view a few photos by clicking here: ProgressBar - Photos
And you can find ProgressBar on OpenStreet Map
Some cool-notable projects:
- bitcoin vending machine
- robot arm to fetch clubmate
- magic wood to switch on/off lights
- blinkwall
- Cool T-shirts
their lab is fool with almost anything you need to play/hack with.
I was really glad to make time and visit them.

An Amazing Book!!!
Must Read !!
I’ve listened to the audiobook like in two days.
Couldnt leave it down.
Then organize a CryptoParty to your local hackerspace
Failures
Every SysAdmin, DevOp, SRE, Computer Engineer or even Developer knows that failures WILL occur. So you need to plan with that constant in mind. Failure causes can be present in hardware, power, operating system, networking, memory or even bugs in software. We often call them system failures but it is possible that a Human can be also the cause of such failure!
Listening to the stories on the latest episode of stack overflow podcast felt compelled to share my own oh-shit moment in recent history.
I am writing this article so others can learn from this story, as I did in the process.
Rolling upgrades
I am a really big fun of rolling upgrades.
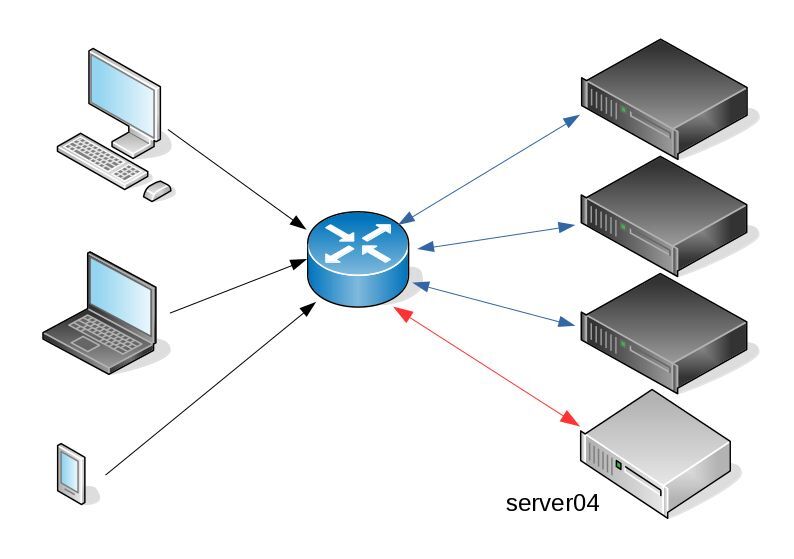
I am used to work with server farms. In a nutshell that means a lot of servers connected to their own switch behind routers/load balancers. This architecture gives me a great opportunity when it is time to perform operations, like scheduling service updates in working hours.
eg. Update software version 1.2.3 to 1.2.4 on serverfarm001
The procedure is really easy:
- From the load balancers, stop any new incoming traffic to one of the servers.
- Monitor all processes on the server and wait for them to terminate.
- When all connections hit zero, stop the service you want to upgrade.
- Perform the service update
- Testing
- Monitor logs and possible alarms
- Be ready to rollback if necessary
- Send some low traffic and try to test service with internal users
- When everything is OK, tell the load balancers to send more traffic
- Wait, monitor everything, test, be sure
- Revert changes on the load balancers so that the specific server can take equal traffic/connection as the others.
This procedure is well established in such environments, and gives us the benefit of working with the whole team in working hours without the need of scheduling a maintenance window in the middle of the night, when low customer traffic is reaching us. During the day, if something is not going as planned, we can also reach other departments and work with them, figuring out what is happening.
Configuration Management
We are using ansible as the main configuration management tool. Every file, playbook, role, task of ansible is under a version control system, so that we can review changes before applying them to production. Viewing diffs from a modern web tool can be a lifesaver in these days.
Virtualization
We also use docker images or virtual images as development machines, so that we can perform any new configuration, update/upgrade on those machines and test it there.
Ansible Inventory
To perform service updates with ansible on servers, we are using the ansible inventory to host some metadata (aka variables) for every machine in a serverfarm. Let me give you an example:
[serverfarm001]
server01 version=1.2.3
server02 version=1.2.3
server03 version=1.2.3
server04 version=1.2.4
And performing the update action via ansible limits
eg.
~> ansible-playbook serverfarm001.yml -t update -C -D -l server04
Rollback
When something is not going as planned, we revert the changes on ansible (version control) and re-push the previous changes on a system. Remember the system is not getting any traffic from the front-end routers.
The Update
I was ready to do the update. Nagios was opened, logs were tailed -f
and then:
~> ansible-playbook serverfarm001.yml -t update
The Mistake
I run the ansible-playbook without limiting the server I wanted to run the update !!!
So all new changes passed through all servers, at once!
On top of that, new configuration broke running software with previous version. When the restart notify of service occurred every server simple stopped!!!
Funny thing, the updated machine server04 worked perfectly, but no traffic was reaching through the load balancers to this server.
Activate Rollback
It was time to run the rollback procedure.
Reverting changes from version control is easy. Took me like a moment or something.
Running again:
~> ansible-playbook serverfarm001.yml
and …
Waiting for Nagios
In 2,5 minutes I had fixed the error and I was waiting for nagios to be green again.
Then … Nothing! Red alerts everywhere!
Oh-Shit Moment
It was time for me to inform everyone what I have done.
Explaining to my colleagues and manager the mistake and trying to figuring out what went wrong with the rollback procedure.
Collaboration
On this crucial moment everything else worked like clockwise.
My colleagues took every action to:
- informing helpdesk
- looking for errors
- tailing logs
- monitor graphs
- viewing nagios
- talking to other people
- do the leg-work in general
and leaving me in piece with calm to figure out what went wrong.
I felt so proud to be part of the team at that specific moment.
If any of you reading this article: Truly thank all guys and gals .
Work-Around
I bypass ansible and copied the correct configuration to all servers via ssh.
My colleagues were telling me the good news and I was going through one by one of ~xx servers.
In 20minutes everything was back in normal.
And finally nagios was green again.
Blameless Post-Mortem
It was time for post-mortem and of course drafting the company’s incident report.
We already knew what happened and how, but nevertheless we need to write everything down and try to keep a good timeline of all steps.
This is not only for reporting but also for us. We need to figure out what happened exactly, do we need more monitoring tools?
Can we place any failsafes in our procedures? Also why the rollback procedure didnt work.
Fixing Rollback
I am writing this paragraph first, but to be honest with you, it took me some time getting to the bottom of this!
Rollback procedure actually is working as planned. I did a mistake with the version control system.
What we have done is to wrap ansible under another script so that we can select the version control revision number at runtime.
This is actually pretty neat, cause it gives us the ability to run ansible with previous versions of our configuration, without reverting in master branch.
The ansible wrapper asks for revision and by default we run it with [tip].
So the correct way to do rollbacks is:
eg.
~> ansible-playbook serverfarm001.yml -rev 238
At the time of problem, I didnt do that. I thought it was better to revert all changes and re-run ansible.
But ansible was running into default mode with tip revision !!
Although I manage pretty well on panic mode, that day my brain was frozen!
Re-Design Ansible
I wrap my head around and tried to find a better solution on performing service updates. I needed to change something that can run without the need of limit in ansible.
The answer has obvious in less than five minutes later:
files/serverfarm001/1.2.3
files/serverfarm001/1.2.4
I need to keep a separated configuration folder and run my ansible playbooks with variable instead of absolute paths.
eg.
- copy: src=files/serverfarm001/{{version}} dest=/etc/service/configuration
That will suffice next time (and actually did!). When the service upgrade is finished, We can simple remove the previous configuration folder without changing anything else in ansible.
Ansible Groups
Another (more simplistic) approach is to create a new group in ansible inventory.
Like you do with your staging Vs production environment.
eg.
[serverfarm001]
server01 version=1.2.3
server02 version=1.2.3
server03 version=1.2.3

[serverfarm001_new]
server04 version=1.2.4
and create a new yml file
---
- hosts: serverfarm001_new
run the ansible-playbook against the new serverfarm001_new group .
Validation
A lot of services nowadays have syntax check commands for their configuration.
You can use this validation process in ansible!
here is an example from ansible docs:
# Update sshd configuration safely, avoid locking yourself out
- template:
    src: etc/ssh/sshd_config.j2
    dest: /etc/ssh/sshd_config
    owner: root
    group: root
    mode: '0600'
    validate: /usr/sbin/sshd -t -f %s
    backup: yes
or you can use registers like this:
  - name: Check named
    shell: /usr/sbin/named-checkconf -t /var/named/chroot
    register: named_checkconf
    changed_when: "named_checkconf.rc == 0"
    notify: anycast rndc reconfig
Conclusion
Everyone makes mistakes. I know, I have some oh-shit moments in my career for sure. Try to learn from these failures and educate others. Keep notes and write everything down in a wiki or in whatever documentation tool you are using internally. Always keep your calm. Do not hide any errors from your team or your manager. Be the first person that informs everyone. If the working environment doesnt make you feel safe, making mistakes, perhaps you should think changing scenery. You will make a mistake, failures will occur. It is a well known fact and you have to be ready when the time is up. Do a blameless post-mortem. The only way a team can be better is via responsibility, not blame. You need to perform disaster-recovery scenarios from time to time and test your backup. And always -ALWAYS- use a proper configuration management tool for all changes on your infrastructure.
post scriptum
After writing this draft, I had a talk with some friends regarding the cloud industry and how this experience can be applied into such environment. The quick answer is you SHOULD NOT.
Working with cloud, means you are mostly using virtualization. Docker images or even Virtual Machines should be ephemeral. When it’s time to perform upgrades (system patching or software upgrades) you should be creating new virtual machines that will replace the old ones. There is no need to do it in any other way. You can rolling replacing the virtual machines (or docker images) without the need of stopping the service in a machine, do the upgrade, testing, put it back. Those ephemeral machines should not have any data or logs in the first place. Cloud means that you can (auto) scale as needed it without thinking where the data are.
thanks for reading.
CAA
Reading RFC 6844 you will find the definition of “DNS Certification Authority Authorization (CAA) Resource Record”.
You can read everything here: RFC 6844
So, what is CAA anyhow?
Certificate Authority
In a nutshell you are declaring which your Certificate Authority is for your domain.
It’s another way to verify that the certificate your site is announcing is in fact signed by the issuer that the certificate is showing.
So let’s see what my certificate is showing:

DNS
Now, let’s find out what my DNS is telling us:
# dig caa balaskas.gr

;; ANSWER SECTION:
balaskas.gr.        5938    IN  CAA 1 issue "letsencrypt.org"
Testing
You can also use the Qualys ssl server test:
https://www.ssllabs.com/ssltest/

Postfix
smtp Vs smtpd

- postfix/smtp
- The SMTP daemon is for sending emails to the Internet (outgoing mail server).
- postfix/smtpd
- The SMTP daemon is for receiving emails from the Internet (incoming mail server).
TLS
Encryption on mail transport is what we call: opportunistic. If both parties (sender’s outgoing mail server & recipient’s incoming mail server) agree to exchange encryption keys, then a secure connection may be used. Otherwise a plain connection will be established. Plain as in non-encrypted aka cleartext over the wire.
SMTP - Outgoing Traffic
In the begging there where only three options in postfix:
- none
- may
- encrypt
The default option on a Centos 6x is none:
# postconf -d | grep smtp_tls_security_level
smtp_tls_security_level =
Nowadays, postfix supports more options, like:
- dane
- verify
- secure
Here is the basic setup, to enable TLS on your outgoing mail server:
smtp_tls_security_level = may
smtp_tls_loglevel = 1
From postfix v2.6 and later, can you disable weak encryption by selecting the cipher suite and protocols you prefer to use:
smtp_tls_ciphers = export
smtp_tls_protocols = !SSLv2, !SSLv3
You can also define where the file that holds all the root certificates on your linux server is, and thus to verify the certificate that provides an incoming mail server:
smtp_tls_CAfile = /etc/pki/tls/certs/ca-bundle.crt
I dont recommend to go higher with your setup, cause (unfortunately) not everyone is using TLS on their incoming mail server!
SMTPD - Incoming Traffic
To enable TLS in your incoming mail server, you need to provide some encryption keys aka certificates!
I use letsencrypt on my server and the below notes are based on that.
Let’s Encrypt
A quick explanation on what exists on your letsencrypt folder:
# ls -1 /etc/letsencrypt/live/example.com/

privkey.pem    ===>  You Private Key
cert.pem       ===>  Your Certificate
chain.pem      ===>  Your Intermediate
fullchain.pem  ===>  Your Certificate with Your Intermediate
Postfix
Below you can find the most basic configuration setup you need for your incoming mail server.
smtpd_tls_ask_ccert = yes
smtpd_tls_security_level = may
smtpd_tls_loglevel = 1
Your mail server is asking for a certificate so that a trusted TLS connection can be established between outgoing and incoming mail server.
The servers must exchange certificates and of course, verify them!
Now, it’s time to present your own domain certificate to the world. Offering only your public certificate cert.pem isnt enough. You have to offer both your certificate and the intermediate’s certificate, so that the sender’s mail server can verify you, by checking the digital signatures on those certificates.
smtpd_tls_cert_file = /etc/letsencrypt/live/example.com/fullchain.pem
smtpd_tls_key_file = /etc/letsencrypt/live/example.com/privkey.pem

smtpd_tls_CAfile = /etc/pki/tls/certs/ca-bundle.crt
smtpd_tls_CApath = /etc/pki/tls/certs
CAfile & CApath helps postfix to verify the sender’s certificate by looking on your linux distribution file, that holds all the root certificates.
And you can also disable weak ciphers and protocols:
smtpd_tls_ciphers = high
smtpd_tls_exclude_ciphers = aNULL, MD5, EXPORT
smtpd_tls_protocols = !SSLv2, !SSLv3
Logs
Here is an example from gmail:
SMTPD - Incoming Mail from Gmail
You can see that there is a trusted TLS connection established From google:
Jun  4 11:52:07 kvm postfix/smtpd[14150]:
        connect from mail-oi0-x236.google.com[2607:f8b0:4003:c06::236]
Jun  4 11:52:08 kvm postfix/smtpd[14150]:
        Trusted TLS connection established from mail-oi0-x236.google.com[2607:f8b0:4003:c06::236]:
        TLSv1.2 with cipher ECDHE-RSA-AES128-GCM-SHA256 (128/128 bits)
Jun  4 11:52:09 kvm postfix/smtpd[14150]:
        4516420F32: client=mail-oi0-x236.google.com[2607:f8b0:4003:c06::236]
Jun  4 11:52:10 kvm postfix/smtpd[14150]:
        disconnect from mail-oi0-x236.google.com[2607:f8b0:4003:c06::236]
SMTP - Outgoing Mail from Gmail
And this is the response To gmail :
Jun  4 12:01:32 kvm postfix/smtpd[14808]:
        initializing the server-side TLS engine
Jun  4 12:01:32 kvm postfix/smtpd[14808]:
        connect from example.com[2a00:1838:20:1::XXXX:XXXX]
Jun  4 12:01:33 kvm postfix/smtpd[14808]:
        setting up TLS connection from example.com[2a00:1838:20:1::XXXX:XXXX]
Jun  4 12:01:33 kvm postfix/smtpd[14808]:
        example.com[2a00:1838:20:1::XXXX:XXXX]: TLS cipher list "aNULL:-aNULL:ALL:!EXPORT:!LOW:!MEDIUM:+RC4:@STRENGTH:!aNULL:!MD5:!EXPORT:!aNULL"
Jun  4 12:01:33 kvm postfix/smtpd[14808]:
        Anonymous TLS connection established from example.com[2a00:1838:20:1::XXXX:XXXX]:
        TLSv1.2 with cipher ECDHE-RSA-AES128-GCM-SHA256 (128/128 bits)
Jun  4 12:01:35 kvm postfix/smtpd[14808]:
        disconnect from example.com[2a00:1838:20:1::XXXX:XXXX]
As you can see -In both cases (sending/receiving)- the mail servers have established a trusted secure TLSv1.2 connection.
The preferred cipher (in both scenarios) is : ECDHE-RSA-AES128-GCM-SHA256
IPv6
Tell postfix to prefer ipv6 Vs ipv4 and use TLS if two mail servers support it !
#IPv6
smtp_address_preference = ipv6
What is the time?
Time offset is the amount of time that is off (or drift) from a specific value. In Linux systems, date is been calculating from the beginning of time. That is 00:00:00 1 January 1970 or as it called Unix Time and systems define date (time) as the number of seconds that have elapsed from 01.01.1970.
It is so important that even a few seconds off can cause tremendous disaster in data centers and applications.
Network Time
To avoid problems with time, systems must and should synchronize their time over the Internet every now and then. This is being done by asking a central NTP server via Network Time Protocol. The most common scenario for infrastructures is to have one or two NTP servers and then all the systems inside this infrastructure can synchronize their time from those machines.
Nagios - NRPE
In my case, I have a centralized NTP Daemon that runs on the Nagios Linux machine. That gives me the opportunity to check the EPOCH time of any system in my infrastructure against the time that the Nagios Server has.
Nagios Check
This is the script I am using:
# ebal, Thu, 11 May 2017 12:08:50 +0000

# EPOCH
TIME=$1
WARN=5
CRIT=10

# seconds
OFFSET=$( echo $(( $(date -d 'now ' +%s) - ${TIME} )) | sed -e 's#-##g' )

if [ "${OFFSET}" -lt "${WARN}" ]; then
        echo "OK"
        exit 0
elif [ "${OFFSET}" -ge "${CRIT}" ]; then
        echo "CRITICAL- ${OFFSET}"
        exit 2
elif [ "${OFFSET}" -lt "${CRIT}" ]; then
        echo "WARNING- ${OFFSET}"
        exit 1
else
        echo "UNKNOWN- ${OFFSET}"
        exit 3
fi
In a nutshell the script gets as the first argument an epoch time and calculate the diff between it’s own epoch time and that.
Example
./check_time_offset $(date -d 'now + 1 min' +%s)
The output is this:
CRITICAL- 60
Nrpe Configuration
This is the configuration for nrpe to run the check_time_offset
# tail -1 /etc/nrpe.d/time_offset.cfg
command[check_time_offset]=/usr/lib64/nagios/plugins/check_time_offset $ARG1$Nagios Configuration
and this is my nagios configuration setup to use a remote nrpe :
define service{
        use                             service-critical
        hostgroup_name                  lnxserver01
        service_description             time_offset
        check_command                   check_nrpe!check_time_offset!$TIMET$
        }
Take a minute to observer a little better the nrpe command.
check_nrpe!check_time_offset!$TIMET$
TIMET
I was having problems passing the nagios epoch time as an argument on the definition of the above service.
Testing the nrpe command as below, I was getting the results I was looking for:
./check_nrpe -H lnxserver01 -c check_time_offset -a $(date -d 'now + 6 sec' +%s)
But is there a way to pass as a nagios argument the output of a command ?
- No
A dear colleague of mine mentioned nagios macros:
$TIMET$ Current time stamp in time_t format (seconds since the UNIX epoch)Perfect !!!
The problem
The last couple weeks, a backup server I am managing is failing to make backups!
The backup procedure (a script via cron daemon) is to rsync data from a primary server to it’s /backup directory. I was getting cron errors via email, informing me that the previous rsync script hasnt already finished when the new one was starting (by checking a lock file). This was strange as the time duration is 12hours. 12 hours werent enough to perform a ~200M data transfer over a 100Mb/s network port. That was really strange.
This is the second time in less than a year that this server is making problems. A couple months ago I had to remove a faulty disk from the software raid setup and check the system again. My notes on the matter, can be found here:
https://balaskas.gr/blog/2016/10/17/linux-raid-mdadm-md0/
Identify the problem
So let us start to identify the problem. A slow rsync can mean a lot of things, especially over ssh. Replacing network cables, viewing dmesg messages, rebooting servers or even changing the filesystem werent changing any things for the better. Time to move on the disks.
Manage and Monitor software RAID devices
On this server, I use raid5 with four hard disks:
# mdadm --verbose --detail /dev/md0
/dev/md0:
        Version : 1.2
  Creation Time : Wed Feb 26 21:00:17 2014
     Raid Level : raid5
     Array Size : 2929893888 (2794.16 GiB 3000.21 GB)
  Used Dev Size : 976631296 (931.39 GiB 1000.07 GB)
   Raid Devices : 4
  Total Devices : 4
    Persistence : Superblock is persistent

    Update Time : Sun May  7 11:00:32 2017
          State : clean
 Active Devices : 4
Working Devices : 4
 Failed Devices : 0
  Spare Devices : 0

         Layout : left-symmetric
     Chunk Size : 512K

           Name : ServerTwo:0  (local to host ServerTwo)
           UUID : ef5da4df:3e53572e:c3fe1191:925b24cf
         Events : 10496

    Number   Major   Minor   RaidDevice State
       4       8       16        0      active sync   /dev/sdb
       1       8       32        1      active sync   /dev/sdc
       6       8       48        2      active sync   /dev/sdd
       5       8        0        3      active sync   /dev/sda
View hardware parameters of hard disk drive
aka test the hard disks:
# hdparm -Tt /dev/sda
/dev/sda:
 Timing cached reads:   2490 MB in  2.00 seconds = 1245.06 MB/sec
 Timing buffered disk reads: 580 MB in  3.01 seconds = 192.93 MB/sec
# hdparm -Tt /dev/sdb
/dev/sdb:
 Timing cached reads:   2520 MB in  2.00 seconds = 1259.76 MB/sec
 Timing buffered disk reads: 610 MB in  3.00 seconds = 203.07 MB/sec
# hdparm -Tt /dev/sdc
/dev/sdc:
 Timing cached reads:   2512 MB in  2.00 seconds = 1255.43 MB/sec
 Timing buffered disk reads: 570 MB in  3.01 seconds = 189.60 MB/sec
# hdparm -Tt /dev/sdd
/dev/sdd:
 Timing cached reads:     2 MB in  7.19 seconds = 285.00 kB/sec
 Timing buffered disk reads:   2 MB in  5.73 seconds = 357.18 kB/sec
Root Cause
Seems that one of the disks (/dev/sdd) in raid5 setup, is not performing as well as the others. The same hard disk had a problem a few months ago.
What I did the previous time, was to remove the disk, reformatting it in Low Level Format and add it again in the same setup. The system rebuild the raid5 and after 24hours everything was performing fine.
However the same hard disk seems that still has some issues . Now it is time for me to remove it and find a replacement disk.
Remove Faulty disk
I need to manually fail and then remove the faulty disk from the raid setup.
Failing the disk
Failing the disk manually, means that mdadm is not recognizing the disk as failed (as it did previously). I need to tell mdadm that this specific disk is a faulty one:
# mdadm --manage /dev/md0 --fail /dev/sdd
mdadm: set /dev/sdd faulty in /dev/md0
Removing the disk
now it is time to remove the faulty disk from our raid setup:
# mdadm --manage /dev/md0 --remove  /dev/sdd
mdadm: hot removed /dev/sdd from /dev/md0
Show details
# mdadm --verbose --detail /dev/md0
/dev/md0:
        Version : 1.2
  Creation Time : Wed Feb 26 21:00:17 2014
     Raid Level : raid5
     Array Size : 2929893888 (2794.16 GiB 3000.21 GB)
  Used Dev Size : 976631296 (931.39 GiB 1000.07 GB)
   Raid Devices : 4
  Total Devices : 3
    Persistence : Superblock is persistent

    Update Time : Sun May  7 11:08:44 2017
          State : clean, degraded
 Active Devices : 3
Working Devices : 3
 Failed Devices : 0
  Spare Devices : 0

         Layout : left-symmetric
     Chunk Size : 512K

           Name : ServerTwo:0  (local to host ServerTwo)
           UUID : ef5da4df:3e53572e:c3fe1191:925b24cf
         Events : 10499

    Number   Major   Minor   RaidDevice State
       4       8       16        0      active sync   /dev/sdb
       1       8       32        1      active sync   /dev/sdc
       4       0        0        4      removed
       5       8        0        3      active sync   /dev/sda
Mounting the Backup
Now it’s time to re-mount the backup directory and re-run the rsync script
mount /backup/
and run the rsync with verbose and progress parameters to review the status of syncing
/usr/bin/rsync -zravxP --safe-links --delete-before --partial --protect-args -e ssh 192.168.2.1:/backup/ /backup/
Everything seems ok.
A replacement order has already been placed.
Rsync times manage to hit ~ 10.27MB/s again!
rsync time for a daily (12h) diff is now again in normal rates:
real    15m18.112s
user    0m34.414s
sys 0m36.850sPowerDNS
My Authoritative PowerDNS configuration, is relatively simple:
Configuration
Here is my configuration:
# egrep -v '^($|#)' pdns.conf
guardian=yes
launch=bind
bind-config=/etc/pdns/named.conf
local-address=MY_IPv4_ADDRESS
local-ipv6=MY_IPv6_ADDRESS
setgid=pdns
setuid=pdns
Bind Backend
I am using a bind backend because I used to run a bind dns server and I am too lazy to change it.
the named.conf doesnt have much:
zone "balaskas.gr" IN {
    type master;
    file "/etc/pdns/var/balaskas.gr";
};
Logs
Today, I’ve noticed some unusual traffic to my server, so I’ve enabled the logging features:
log-dns-details=yes
log-dns-queries=yes
query-logging=yes
DDoS
The horror !!!
In less than 10minutes or so, almost 2500 “unique” IPs were “attacking” my auth-dns with random queries.
Let me give you an example:
utmzcnqjytkpmnop.madingyule.net
gdqlozsdqngdidkb.madingyule.net
wrojktwlwhevwtup.madingyule.net
enozexazqxoj.madingyule.net
izahejotetwlkhql.madingyule.net
IPtables
iptables to the rescue:
iptables -I INPUT -m string --algo bm --string "madingyule" -j DROP
Any dns query with the string madingyule will be blocked in INPUT chain with Boyer–Moore string search algorithm.
dnsdist
I need a more permanent solution than reading logs and block attacks with iptables, so I’ve asked the IRC about it. They pointed me to dnsdist.
I’ve already knew about dnsdist but I always thought it was a solution for recursors and not for auth-ns.
I was wrong! dnsdist is a highly DNS-, DoS- and abuse-aware loadbalancer and works fine for auth-ns setup too.
pdns configuration
My auth-ns configuration had to change to something like this:
any-to-tcp=no
disable-tcp=yes
dname-processing=yes
guardian=yes
launch = bind
bind-config = /etc/pdns/named.conf
local-address=127.0.0.1
local-port=5353
Disabling any global listener and tcp.
dnsdist configuration
here is my dnsdist configuration:
/etc/dnsdist/dnsdist.conf
-- accept DNS queries on UDP and TCP
addLocal("MY_IPv4_IP:53")
addLocal("[MY_IPv6_IP]:53")

-- fwd queries to localhost
newServer({address="127.0.0.1:5353"})

-- resets the list to this array
setACL("::/0")
addACL("0.0.0.0/0")
I am not 100% sure about the ACL but everything seems ok.
Thats it !!!! - Finished
dnsdist - client
To connect to the dnsdist daemon, you need to add the below configuration:
controlSocket("127.0.0.1")That means, after reloading the daemon, you can connect on it with:
# dnsdist -c
Extra
Logs
 -- log everything
 addAction(AllRule(), LogAction("/var/log/dnsdist.log", false, true, false))
Domain Blocking
Let’s start with the above iptables example:
addDomainBlock("wanbo88.net.")

addDomainBlock("madingyule.net.")
You can connect to dnsdist client (see above) and and any domain you wan to block without restarting your dnsdist service.
Allow Action
Another trick you can do, is to create some custom rules by allowing any DNS queries for your domains and drop any other dns query. You can do this with something like that:
addAction(makeRule("balaskas.gr.")   , AllowAction())
addAction(makeRule("balaskas.gr.")  , AllowAction())

addAction(AllRule()                  , DropAction())
Rule Order
Just remember, that the rules will be processed in line order of the file.
Block ANY
You can drop all ANY queries with:
addAction(QTypeRule(dnsdist.ANY), DropAction())although I dont recommend it.
Rate-Limiting - QPS (Queries Per Second)
Now to the good stuff: rate limiting
A simple rule is something like the below:
-- drop queries exceeding 5 qps, grouped by /24 for IPv4 and /64 for IPv6
addAction(MaxQPSIPRule(5, 24, 64), DropAction())
If you want to drop everything when they pass the 5qps:
addAction(MaxQPSIPRule(5), DropAction())Delay
An alternative approach is to delay everything for more than 5qps (rate limiting), this may make the bot (ddos) to overlook you.
-- Delay for 1000ms aka 1s for 5qps
addDelay(MaxQPSIPRule(5), 1000)
File Descriptors
Working on a VPS (virtual private server), I’ve troubled with file descriptors.
Message in logs from dnsdist is:
Warning, this configuration can use more than 1057 file descriptors, web server and console connections not included, and the current limit is 1024
From the command line you can tweak it to 2048 like this:
# ulimit -n 2048
If you need to make it permanent:
vim /etc/security/limits.conf
* - nofile 2048Traffic
okei, it’s time to see what’s the traffic:
topQueries(20,2)will report the domains that are reaching to our dnsdsist.
topQueries() will report everything
topQueries(20,1)will report TLD (Top Level Domains)
Identify your traffic:
grepq("balaskas.gr")Monit
So dnsdist is now in front of my powerdns auth-ns setup and handles everything, blocking what is necessary.
To be sure that the daemon is up and running:
/etc/monit.d/dnsdist.monit
check process dnsdist with pidfile /var/run/dnsdist.pid
    alert evaggelos_AT_balaskas_DOT_gr only on { timeout, nonexist }
    start program = "/etc/init.d/dnsdist start"
    stop program  = "/etc/init.d/dnsdist stop"
dnsdist - basics
Some basic commands about dnsdist (when connecting to the client):
Commands:
addAction(                         addAnyTCRule()                     addDelay(
addDisableValidationRule(          addDNSCryptBind(                   addDomainBlock(
addDomainSpoof(                    addDynBlocks(                      addLocal(
addLuaAction(                      addNoRecurseRule(                  addPoolRule(
addQPSLimit(                       addQPSPoolRule(                    addResponseAction(
AllowAction()                      AllowResponseAction()              AllRule()
AndRule(                           benchRule(                         carbonServer(
clearDynBlocks()                   clearQueryCounters()               clearRules()
controlSocket(                     DelayAction(                       DelayResponseAction(
delta()                            DisableValidationAction()          DropAction()
DropResponseAction()               dumpStats()                        exceedNXDOMAINs(
exceedQRate(                       exceedQTypeRate(                   exceedRespByterate(
exceedServFails(                   firstAvailable                     fixupCase(
generateDNSCryptCertificate(       generateDNSCryptProviderKeys(      getPoolServers(
getQueryCounters(                  getResponseRing()                  getServer(
getServers()                       grepq(                             leastOutstanding
LogAction(                         makeKey()                          MaxQPSIPRule(
MaxQPSRule(                        mvResponseRule(                    mvRule(
newDNSName(                        newQPSLimiter(                     newRemoteLogger(
newRuleAction(                     newServer(                         newServerPolicy(
newSuffixMatchNode()               NoRecurseAction()                  PoolAction(
printDNSCryptProviderFingerprint(  QNameLabelsCountRule(              QNameWireLengthRule(
QTypeRule(                         RCodeRule(                         RegexRule(
registerDynBPFFilter(              RemoteLogAction(                   RemoteLogResponseAction(
rmResponseRule(                    rmRule(                            rmServer(
roundrobin                         setACL(                            setAPIWritable(
setDNSSECPool(                     setECSOverride(                    setECSSourcePrefixV4(
setECSSourcePrefixV6(              setKey(                            setLocal(
setMaxTCPClientThreads(            setMaxTCPQueuedConnections(        setMaxUDPOutstanding(
setQueryCount(                     setQueryCountFilter(               setRules(
setServerPolicy(                   setServerPolicyLua(                setServFailWhenNoServer(
setTCPRecvTimeout(                 setTCPSendTimeout(                 setUDPTimeout(
setVerboseHealthChecks(            show(                              showACL()
showDNSCryptBinds()                showDynBlocks()                    showResponseLatency()
showResponseRules()                showRules()                        showServerPolicy()
showServers()                      showTCPStats()                     showVersion()
shutdown()                         SpoofAction(                       TCAction()
testCrypto()                       topBandwidth(                      topClients(
topQueries(                        topResponseRule()                  topResponses(
topRule()                          topSlow(                           truncateTC(
unregisterDynBPFFilter(            webserver(                         whashed
wrandom                            addACL(
dnsdist - ACL
Keep in mind that the default ACL is:
> showACL()
127.0.0.0/8
10.0.0.0/8
100.64.0.0/10
169.254.0.0/16
192.168.0.0/16
172.16.0.0/12
::1/128
fc00::/7
fe80::/10
Log Rotate
/etc/logrotate.d/dnsdist
/var/log/dnsdist.log {
    rotate 7
    daily
    dateext
    delaycompress
    compress
    postrotate
        [ ! -f /var/run/dnsdist.pid ] || kill -USR1 `cat /var/run/dnsdist.pid`
    endscript
}
After upgrading one of my linux boxes from CentOS 6.8 to 6.9, I wanted to find out the files that I had to review. From experience I already knew what file names I should check: .rpmsave & .rpmnew
The command I usually type is: find
# find /etc/|egrep ".*rpm(save|new)$"

/etc/rc.d/init.d/postgrey.rpmsave
/etc/php.ini.rpmnew
/etc/sudoers.rpmnew
/etc/postfix/postgrey_whitelist_clients.local.rpmsave
/etc/sysctl.conf.rpmnew
a more nice way is to tell find to search for files with type: file to exclude any binary searches:
# find /etc/ -type f |egrep ".*rpm(save|new)$"

/etc/rc.d/init.d/postgrey.rpmsave
/etc/php.ini.rpmnew
/etc/sudoers.rpmnew
/etc/postfix/postgrey_whitelist_clients.local.rpmsave
/etc/sysctl.conf.rpmnew
but find is a very powerful command, and reading through the manual page:
-regex pattern
File name matches regular expression pattern. This is a match on the whole path, not a
search. For example, to match a file named ‘./fubar3’, you can use the regular expression
‘.bar.’ or ‘.b.3’, but not ‘f.r3’. The regular expressions understood by find are by
default Emacs Regular Expressions, but this can be changed with the -regextype option.
ok, we are getting somewhere. I can use -regex with an emacs regular expression pattern to search.
# find /etc/ -type f -regex ".*rpm(save|new)$"
Nothing in output !!! aka this is a “WAT ?????” moment.

Perhaps I am not typing an emacs regex.
Let’s try to use an alternative:
# find /etc/ -type f -regextype -name "*rpmsave$"
valid types are
findutils-default',awk’,egrep',ed’,emacs',gnu-awk’,grep',posix-awk’,posix-basic',posix-egrep’,posix-extended',posix-minimal-basic’, `sed’.
With this typo, I can find out what the alternatives
ok, let’s try egrep or anything else:
# find /etc/ -type f -regex ".*rpm(save|new)$" -regextype sed

# find /etc/ -type f -regex ".*rpm(save|new)$" -regextype posix-egrep
# find /etc/ -type f -name ".*rpm(save|new)$" -regextype posix-egrep

# find /etc/ -type f -name ".*rpm(save|new)$" -regextype egrep
# find /etc/ -type f -name ".*rpm(save|new)$" -regextype sed
# find /etc/ -type f -name ".*rpmsave$" -regextype sed
# find /etc/ -type f -name ".*rpmsave$" -regextype posix-egrep
# find /etc/ -type f -name ".*rpmsave$" -regextype egrep

# find /etc/ -type f -regex ".*rpm(save)$" -regextype egrep
# find /etc/ -type f -regex ".*rpm(save|new)$" -regextype egrep
Nothing !!!
Am I typing this correctly ?
# find /etc/ -type f | egrep ".*rpm(save|new)$"

/etc/rc.d/init.d/postgrey.rpmsave
/etc/php.ini.rpmnew
/etc/sudoers.rpmnew
/etc/postfix/postgrey_whitelist_clients.local.rpmsave
/etc/sysctl.conf.rpmnew
then, what the h3ll?
Let’s read the manual page, once more:
The -daystart, -follow and -regextype options are different in this respect, and have an effect only on tests which appear later in the command line. Therefore, for clarity, it is best to place them at the beginning of the expression
Exhhmmmmm
I need to put -regextype before the regex.
# find /etc/ -type f -regextype egrep -regex ".*rpm(save|new)$"

/etc/rc.d/init.d/postgrey.rpmsave
/etc/php.ini.rpmnew
/etc/sudoers.rpmnew
/etc/postfix/postgrey_whitelist_clients.local.rpmsave
/etc/sysctl.conf.rpmnew
Yeah !

Working with VPS (Virtual Private Server), sometimes means that you dont have a lot of memory.
That’s why, we use the swap partition, a system partition that our linux kernel use as extended memory. It’s slow but necessary when your system needs more memory. Even if you dont have any free partition disk, you can use a swap file to add to your linux system.
Create the Swap File
[root@centos7] # dd if=/dev/zero of=/swapfile count=1000 bs=1MiB
1000+0 records in
1000+0 records out
1048576000 bytes (1.0 GB) copied, 3.62295 s, 289 MB/s

[root@centos7] # du -sh /swapfile
1.0G    /swapfile
That is 1G file
Make Swap
[root@centos7] # mkswap -L swapfs /swapfile
Setting up swapspace version 1, size = 1048572 KiB
LABEL=swapfs, UUID=d8af8f19-5578-4c8e-b2b1-3ff57edb71f9
Permissions
[root@centos7] # chmod 0600 /swapfile
Activate
[root@centos7] # swapon /swapfile
Check
# free
              total        used        free      shared  buff/cache   available
Mem:        1883716     1613952       79172       54612      190592       64668
Swap:       1023996           0     1023996
fstab
Now for the final step, we need to edit /etc/fstab
/swapfile swap swap defaults 0 0Docker Swarm
The native Docker Container Orchestration system is Docker Swarm that in simple terms means that you can have multiple docker machines (hosts) to run your multiple docker containers (replicas). It is best to work with Docker Engine v1.12 and above as docker engine includes docker swarm natively.
Docker Swarm logo:

In not so simply terms, docker instances (engines) running on multiple machines (nodes), communicating together (VXLAN) as a cluster (swarm).
Nodes
To begin with, we need to create our docker machines. One of the nodes must be the manager and the others will run as workers. For testing purposes I will run three (3) docker engines:
- Manager Docker Node: myengine0
- Worker Docker Node 1: myengine1
- Worker Docker Node 2: myengine2
Drivers
A docker node is actually a machine that runs the docker engine in the swarm mode. The machine can be a physical, virtual, a virtualbox, a cloud instance, a VPS, a AWS etc etc
As the time of this blog post, officially docker supports natively the below drivers:
- Amazon Web Services
- Microsoft Azure
- Digital Ocean
- Exoscale
- Google Compute Engine
- Generic
- Microsoft Hyper-V
- OpenStack
- Rackspace
- IBM Softlayer
- Oracle VirtualBox
- VMware vCloud Air
- VMware Fusion
- VMware vSphere
QEMU - KVM
but there are unofficial drivers also.
I will use the qemu - kvm driver from this github repository: https://github.com/dhiltgen/docker-machine-kvm
The simplest way to add the kvm driver is this:
> cd /usr/local/bin/
> sudo -s
# wget -c https://github.com/dhiltgen/docker-machine-kvm/releases/download/v0.7.0/docker-machine-driver-kvm
# chmod 0750 docker-machine-driver-kvm
Docker Machines
The next thing we need to do, is to create our docker machines. Look on your distro’s repositories:
# yes | pacman -S docker-machineManager
$ docker-machine create -d kvm myengine0

Running pre-create checks...
Creating machine...
(myengine0) Image cache directory does not exist, creating it at /home/ebal/.docker/machine/cache...
(myengine0) No default Boot2Docker ISO found locally, downloading the latest release...
(myengine0) Latest release for github.com/boot2docker/boot2docker is v1.13.1
(myengine0) Downloading /home/ebal/.docker/machine/cache/boot2docker.iso from https://github.com/boot2docker/boot2docker/releases/download/v1.13.1/boot2docker.iso...
(myengine0) 0%....10%....20%....30%....40%....50%....60%....70%....80%....90%....100%
(myengine0) Copying /home/ebal/.docker/machine/cache/boot2docker.iso to /home/ebal/.docker/machine/machines/myengine0/boot2docker.iso...

Waiting for machine to be running, this may take a few minutes...
Detecting operating system of created instance...
Waiting for SSH to be available...
Detecting the provisioner...
Provisioning with boot2docker...
Copying certs to the local machine directory...
Copying certs to the remote machine...
Setting Docker configuration on the remote daemon...
Checking connection to Docker...
Docker is up and running!
To see how to connect your Docker Client to the Docker Engine running on this virtual machine, run: docker-machine env myengine0
Worker 1
$ docker-machine create -d kvm myengine1
Running pre-create checks...
Creating machine...
(myengine1) Copying /home/ebal/.docker/machine/cache/boot2docker.iso to /home/ebal/.docker/machine/machines/myengine1/boot2docker.iso...
Waiting for machine to be running, this may take a few minutes...
Detecting operating system of created instance...
Waiting for SSH to be available...
Detecting the provisioner...
Provisioning with boot2docker...
Copying certs to the local machine directory...
Copying certs to the remote machine...
Setting Docker configuration on the remote daemon...
Checking connection to Docker...
Docker is up and running!
To see how to connect your Docker Client to the Docker Engine running on this virtual machine, run: docker-machine env myengine1
Worker 2
$ docker-machine create -d kvm myengine2
Running pre-create checks...
Creating machine...
(myengine2) Copying /home/ebal/.docker/machine/cache/boot2docker.iso to /home/ebal/.docker/machine/machines/myengine2/boot2docker.iso...
Waiting for machine to be running, this may take a few minutes...
Detecting operating system of created instance...
Waiting for SSH to be available...
Detecting the provisioner...
Provisioning with boot2docker...
Copying certs to the local machine directory...
Copying certs to the remote machine...
Setting Docker configuration on the remote daemon...
Checking connection to Docker...
Docker is up and running!
To see how to connect your Docker Client to the Docker Engine running on this virtual machine, run: docker-machine env myengine2
List your Machines
$ docker-machine env myengine0
export DOCKER_TLS_VERIFY="1"
export DOCKER_HOST="tcp://192.168.42.126:2376"
export DOCKER_CERT_PATH="/home/ebal/.docker/machine/machines/myengine0"
export DOCKER_MACHINE_NAME="myengine0"
# Run this command to configure your shell:
# eval $(docker-machine env myengine0)
$ docker-machine ls

NAME        ACTIVE   DRIVER   STATE     URL                         SWARM   DOCKER    ERRORS
myengine0   -        kvm      Running   tcp://192.168.42.126:2376           v1.13.1
myengine1   -        kvm      Running   tcp://192.168.42.51:2376            v1.13.1
myengine2   -        kvm      Running   tcp://192.168.42.251:2376           v1.13.1
Inspect
You can get the IP of your machines with:
$ docker-machine ip myengine0
192.168.42.126

$ docker-machine ip myengine1
192.168.42.51

$ docker-machine ip myengine2
192.168.42.251
with ls as seen above or use the inspect parameter for a full list of information regarding your machines in a json format:
$ docker-machine inspect myengine0
If you have jq you can filter out some info
$ docker-machine inspect myengine0  | jq .'Driver.DiskPath'

"/home/ebal/.docker/machine/machines/myengine0/myengine0.img"
SSH
To enter inside the kvm docker machine, you can use ssh
Manager
$ docker-machine ssh myengine0

                        ##         .
                  ## ## ##        ==
               ## ## ## ## ##    ===
           /"""""""""""""""""___/ ===
      ~~~ {~~ ~~~~ ~~~ ~~~~ ~~~ ~ /  ===- ~~~
           ______ o           __/
                          __/
              ___________/
 _                 _   ____     _            _
| |__   ___   ___ | |_|___  __| | ___   ___| | _____ _ __
| '_  / _  / _ | __| __) / _` |/ _  / __| |/ / _  '__|
| |_) | (_) | (_) | |_ / __/ (_| | (_) | (__|   <  __/ |
|_.__/ ___/ ___/ __|_______,_|___/ ___|_|____|_|
Boot2Docker version 1.13.1, build HEAD : b7f6033 - Wed Feb  8 20:31:48 UTC 2017
Docker version 1.13.1, build 092cba3
Worker 1
$ docker-machine ssh myengine1

                        ##         .
                  ## ## ##        ==
               ## ## ## ## ##    ===
           /"""""""""""""""""___/ ===
      ~~~ {~~ ~~~~ ~~~ ~~~~ ~~~ ~ /  ===- ~~~
           ______ o           __/
                          __/
              ___________/
 _                 _   ____     _            _
| |__   ___   ___ | |_|___  __| | ___   ___| | _____ _ __
| '_  / _  / _ | __| __) / _` |/ _  / __| |/ / _  '__|
| |_) | (_) | (_) | |_ / __/ (_| | (_) | (__|   <  __/ |
|_.__/ ___/ ___/ __|_______,_|___/ ___|_|____|_|
Boot2Docker version 1.13.1, build HEAD : b7f6033 - Wed Feb  8 20:31:48 UTC 2017
Docker version 1.13.1, build 092cba3
Worker 2
$ docker-machine ssh myengine2

                        ##         .
                  ## ## ##        ==
               ## ## ## ## ##    ===
           /"""""""""""""""""___/ ===
      ~~~ {~~ ~~~~ ~~~ ~~~~ ~~~ ~ /  ===- ~~~
           ______ o           __/
                          __/
              ___________/
 _                 _   ____     _            _
| |__   ___   ___ | |_|___  __| | ___   ___| | _____ _ __
| '_  / _  / _ | __| __) / _` |/ _  / __| |/ / _  '__|
| |_) | (_) | (_) | |_ / __/ (_| | (_) | (__|   <  __/ |
|_.__/ ___/ ___/ __|_______,_|___/ ___|_|____|_|
Boot2Docker version 1.13.1, build HEAD : b7f6033 - Wed Feb  8 20:31:48 UTC 2017
Docker version 1.13.1, build 092cba3
Swarm Cluster
Now it’s time to build a swarm of docker machines!
Initialize the manager
docker@myengine0:~$  docker swarm init --advertise-addr 192.168.42.126

Swarm initialized: current node (jwyrvepkz29ogpcx18lgs8qhx) is now a manager.

To add a worker to this swarm, run the following command:

    docker swarm join
    --token SWMTKN-1-4vpiktzp68omwayfs4c3j5mrdrsdavwnewx5834g9cp6p1koeo-bgcwtrz6srt45qdxswnneb6i9
    192.168.42.126:2377

To add a manager to this swarm, run 'docker swarm join-token manager' and follow the instructions.
Join Worker 1
docker@myengine1:~$  docker swarm join
>     --token SWMTKN-1-4vpiktzp68omwayfs4c3j5mrdrsdavwnewx5834g9cp6p1koeo-bgcwtrz6srt45qdxswnneb6i9
>     192.168.42.126:2377

This node joined a swarm as a worker.
Join Worker 2
docker@myengine2:~$   docker swarm join
>     --token SWMTKN-1-4vpiktzp68omwayfs4c3j5mrdrsdavwnewx5834g9cp6p1koeo-bgcwtrz6srt45qdxswnneb6i9
>     192.168.42.126:2377

This node joined a swarm as a worker.
From the manager
docker@myengine0:~$  docker node ls

ID                           HOSTNAME   STATUS  AVAILABILITY  MANAGER STATUS
jwyrvepkz29ogpcx18lgs8qhx *  myengine0  Ready   Active        Leader
m5akhw7j60fru2d0an4lnsgr3    myengine2  Ready   Active
sfau3r42bqbhtz1c6v9hnld67    myengine1  Ready   Active
Info
We can find more information about the docker-machines running the docker info command when you have ssh-ed the nodes:
eg. the swarm part:
manager
Swarm: active
 NodeID: jwyrvepkz29ogpcx18lgs8qhx
 Is Manager: true
 ClusterID: 8fjv5fzp0wtq9hibl7w2v65cs
 Managers: 1
 Nodes: 3
 Orchestration:
  Task History Retention Limit: 5
 Raft:
  Snapshot Interval: 10000
  Number of Old Snapshots to Retain: 0
  Heartbeat Tick: 1
  Election Tick: 3
 Dispatcher:
  Heartbeat Period: 5 seconds
 CA Configuration:
  Expiry Duration: 3 months
 Node Address: 192.168.42.126
 Manager Addresses:
  192.168.42.126:2377
worker1
Swarm: active
 NodeID: sfau3r42bqbhtz1c6v9hnld67
 Is Manager: false
 Node Address: 192.168.42.51
 Manager Addresses:
  192.168.42.126:2377
worker 2
Swarm: active
 NodeID: m5akhw7j60fru2d0an4lnsgr3
 Is Manager: false
 Node Address: 192.168.42.251
 Manager Addresses:
  192.168.42.126:2377
Services
Now it’s time to test our docker swarm by running a container service across our entire fleet!
For testing purposes we chose 6 replicas of an nginx container:
docker@myengine0:~$ docker service create --replicas 6 -p 80:80 --name web nginx

ql6iogo587ibji7e154m7npal
List images
docker@myengine0:~$  docker images
REPOSITORY          TAG                 IMAGE ID            CREATED             SIZE
nginx               <none>              db079554b4d2        9 days ago          182 MB
List of services
regarding your docker registry or your internet connection, we will see the replicas running:
docker@myengine0:~$ docker service ls
ID            NAME  MODE        REPLICAS  IMAGE
ql6iogo587ib  web   replicated  0/6       nginx:latest

docker@myengine0:~$ docker service ls
ID            NAME  MODE        REPLICAS  IMAGE
ql6iogo587ib  web   replicated  2/6       nginx:latest

docker@myengine0:~$ docker service ls
ID            NAME  MODE        REPLICAS  IMAGE
ql6iogo587ib  web   replicated  3/6       nginx:latest

docker@myengine0:~$ docker service ls
ID            NAME  MODE        REPLICAS  IMAGE
ql6iogo587ib  web   replicated  6/6       nginx:latest
docker@myengine0:~$  docker service ps web

ID            NAME   IMAGE         NODE       DESIRED STATE  CURRENT STATE           ERROR  PORTS
t3v855enecgv  web.1  nginx:latest  myengine1  Running        Running 17 minutes ago
xgwi91plvq00  web.2  nginx:latest  myengine2  Running        Running 17 minutes ago
0l6h6a0va2fy  web.3  nginx:latest  myengine0  Running        Running 16 minutes ago
qchj744k0e45  web.4  nginx:latest  myengine1  Running        Running 17 minutes ago
udimh2bokl8k  web.5  nginx:latest  myengine2  Running        Running 17 minutes ago
t50yhhtngbac  web.6  nginx:latest  myengine0  Running        Running 16 minutes ago
Browser
To verify that our replicas are running as they should:

Scaling a service
It’s really interesting that we can scale out or scale down our replicas on the fly !
from the manager
docker@myengine0:~$  docker service ls
ID            NAME  MODE        REPLICAS  IMAGE
ql6iogo587ib  web   replicated  6/6       nginx:latest

docker@myengine0:~$ docker service ps web
ID            NAME   IMAGE         NODE       DESIRED STATE  CURRENT STATE       ERROR  PORTS
t3v855enecgv  web.1  nginx:latest  myengine1  Running        Running 3 days ago
xgwi91plvq00  web.2  nginx:latest  myengine2  Running        Running 3 days ago
0l6h6a0va2fy  web.3  nginx:latest  myengine0  Running        Running 3 days ago
qchj744k0e45  web.4  nginx:latest  myengine1  Running        Running 3 days ago
udimh2bokl8k  web.5  nginx:latest  myengine2  Running        Running 3 days ago
t50yhhtngbac  web.6  nginx:latest  myengine0  Running        Running 3 days ago
Scale Down
from the manager
$ docker service scale web=3
web scaled to 3

docker@myengine0:~$ docker service ls
ID            NAME  MODE        REPLICAS  IMAGE
ql6iogo587ib  web   replicated  3/3       nginx:latest

docker@myengine0:~$ docker service ps web
ID            NAME   IMAGE         NODE       DESIRED STATE  CURRENT STATE       ERROR  PORTS
0l6h6a0va2fy  web.3  nginx:latest  myengine0  Running        Running 3 days ago
qchj744k0e45  web.4  nginx:latest  myengine1  Running        Running 3 days ago
udimh2bokl8k  web.5  nginx:latest  myengine2  Running        Running 3 days ago
Scale Up
from the manager
docker@myengine0:~$ docker service scale web=8
web scaled to 8
docker@myengine0:~$
docker@myengine0:~$ docker service ls
ID            NAME  MODE        REPLICAS  IMAGE
ql6iogo587ib  web   replicated  3/8       nginx:latest
docker@myengine0:~$
docker@myengine0:~$ docker service ls
ID            NAME  MODE        REPLICAS  IMAGE
ql6iogo587ib  web   replicated  4/8       nginx:latest
docker@myengine0:~$
docker@myengine0:~$ docker service ls
ID            NAME  MODE        REPLICAS  IMAGE
ql6iogo587ib  web   replicated  8/8       nginx:latest
docker@myengine0:~$
docker@myengine0:~$
docker@myengine0:~$ docker service ps web
ID            NAME   IMAGE         NODE       DESIRED STATE  CURRENT STATE           ERROR  PORTS
lyhoyseg8844  web.1  nginx:latest  myengine1  Running        Running 7 seconds ago
w3j9bhcn9f6e  web.2  nginx:latest  myengine2  Running        Running 8 seconds ago
0l6h6a0va2fy  web.3  nginx:latest  myengine0  Running        Running 3 days ago
qchj744k0e45  web.4  nginx:latest  myengine1  Running        Running 3 days ago
udimh2bokl8k  web.5  nginx:latest  myengine2  Running        Running 3 days ago
vr8jhbum8tlg  web.6  nginx:latest  myengine1  Running        Running 7 seconds ago
m4jzati4ddpp  web.7  nginx:latest  myengine2  Running        Running 8 seconds ago
7jek2zvuz6fs  web.8  nginx:latest  myengine0  Running        Running 11 seconds ago
prerequisites
You need to already have a LDAP instance in your infrastructure that you can reach from your test linux machine. Your ldap has an organization unit for people and one for groups.
Ldap server conf
It is always a good thing to write your notes/settings beforehand:
Ldap Server: myldapserver.example.org
Domain Component: dc=example,dc=org

People base: ou=people,dc=example,dc=org
Group base: ou=Groups,dc=example,dc=org

bind user: userpam
bind pass: 1234567890
Installation
On your centos 7 machine, you have to install two packages:
# yum -y install nss-pam-ldapd

  Installing : nscd-2.17-157.el7_3.1.x86_64
  Installing : nss-pam-ldapd-0.8.13-8.el7.x86_64
local LDAP name service daemon
Edit the /etc/nslcd.conf file accordingly to your ldap setup.
# grep -Ev '#|^$' /etc/nslcd.conf
uid nslcd
gid ldap

uri ldap://myldapserver.example.org
base ou=people,dc=example,dc=org

ssl no
tls_cacertdir /etc/openldap/cacerts
This is the most basic configuration file, without any TLS (encryption) support, but for our test purposes is ok.
restart nslcd
Every time you change something to nslcd.conf file, you need to restart the service:
# systemctl restart nslcd
Name Service Switch
By default the Name Service Switch have ldap support for the below pam services:
# grep ldap /etc/nsswitch.conf

passwd:     files sss ldap
shadow:     files sss ldap
group:      files sss ldap
netgroup:   files sss ldap
automount:  files ldap
if not, just add it yourself. Just remember that the order is from left to right, that means your centos machine will first try to look in your local files, then to your System Security Services Daemon and finally to your ldap URI !
Testing
In this first step, the only way to test that your linux machine can talk to your linux server is via getent looking up on the passwd service:
# getent passwd | grep ebal

ebal:x:374:374:Evaggelos Balaskas:/home/ebal:/bin/bash
Ldap Bind Password
The above example is for anonymous bind against your ldap server. That means that secrets (as the password of the user) can not be viewed (actually tested it on the encrypted hash) as for that you need to bind to your ldap server with your credentials.
# egrep -v '^$|#' /etc/nslcd.conf

uid nslcd
gid ldap
uri ldap://myldapserver.example.org
base ou=people,dc=example,dc=org

binddn cn=userpam,dc=example,dc=org
bindpw 1234567890

ssl no
tls_cacertdir /etc/openldap/cacerts
restart nslcd
# systemctl restart nslcd
Testing
Now it’s time for your first ssh login:
~> ssh testvm
ebal@testvm's password:

Last login: Mon Feb 13 22:50:12 2017
/usr/bin/id: cannot find name for group ID 374

~>  id
uid=374(ebal) gid=374 groups=374
You can login without problem, but there is a warning for your group id.
Ldap Group Configuration
So, we need to add support for our group base on the nslcd configuration file:
# egrep -v '^$|#' /etc/nslcd.conf

uid nslcd
gid ldap
uri ldap://myldapserver.example.org
base ou=people,dc=example,dc=org
binddn cn=userpam,dc=example,dc=org
bindpw 1234567890

base group ou=Groups,dc=example,dc=org

ssl no
tls_cacertdir /etc/openldap/cacerts
restart nslcd
# systemctl restart nslcdtesting
We first test it against getent using the group service:
# getent group | grep 374
ebal:*:374
and after that, we can ssh again to our linux machine:
~> ssh testvm
ebal@testvm's password:
Last login: Mon Feb 13 23:14:42 2017 from testserver

~> id
uid=374(ebal) gid=374(ebal) groups=374(ebal)
Now it shows the group name without a problem.
Fairphone FP1U
I have this phone for more than 3,5 years

running on Android v4.2 !
Gapps
I dont have them, I dont even have a google account.
Although fairphone comes with an extra GApps package zip, I haven’t installed them either.
Fake GApps
Unfortunately there are some android apps that need GApps to run. So, without any further ado, here are my notes on how to add support for alternative open sources.
Disclaimer
Device may brick ! Do a full backup and keep it somewhere safe.
Location Service
We start with the easy one, how to add support for location service.
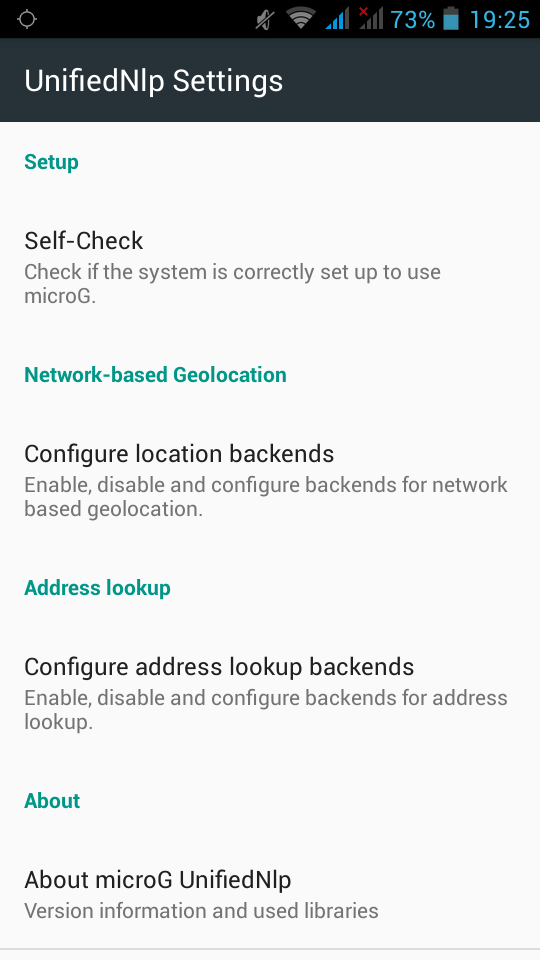
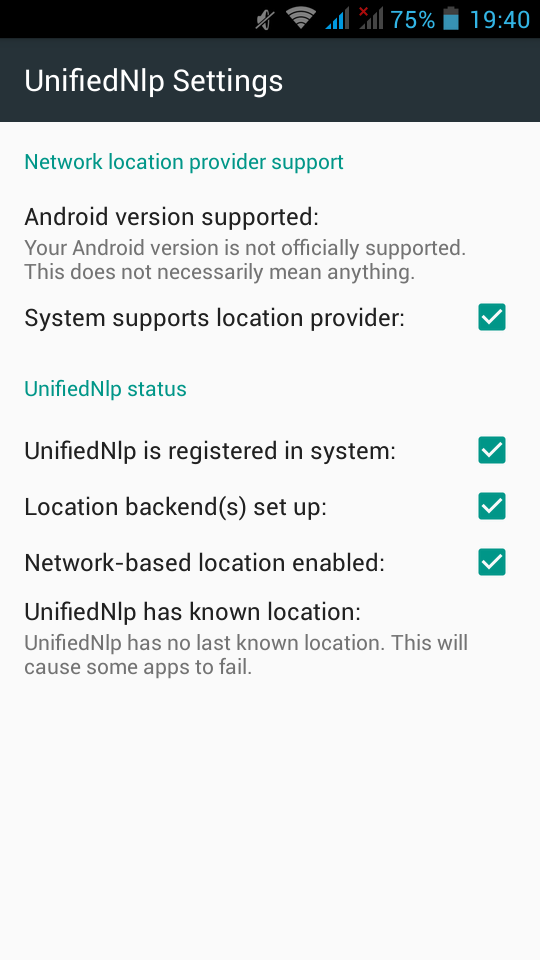
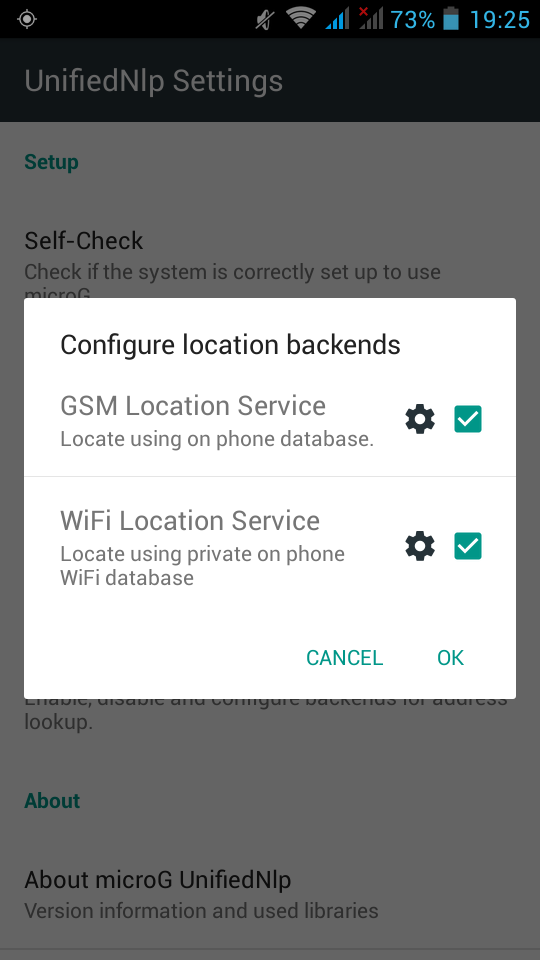
In Fdroid we can find the UnifiedNlp suite of packages that work as a Location provider middleware. On my device, I installed the below apps:
https://f-droid.org/repository/browse/?fdfilter=UnifiedNlp
UnifiedNlp
Screenshots from my fairphone, after a few reboots
Unified github
Just to make things perfectly clear, you can verify fdroid’s packages against these:
https://github.com/microg/android_packages_apps_UnifiedNlp/releases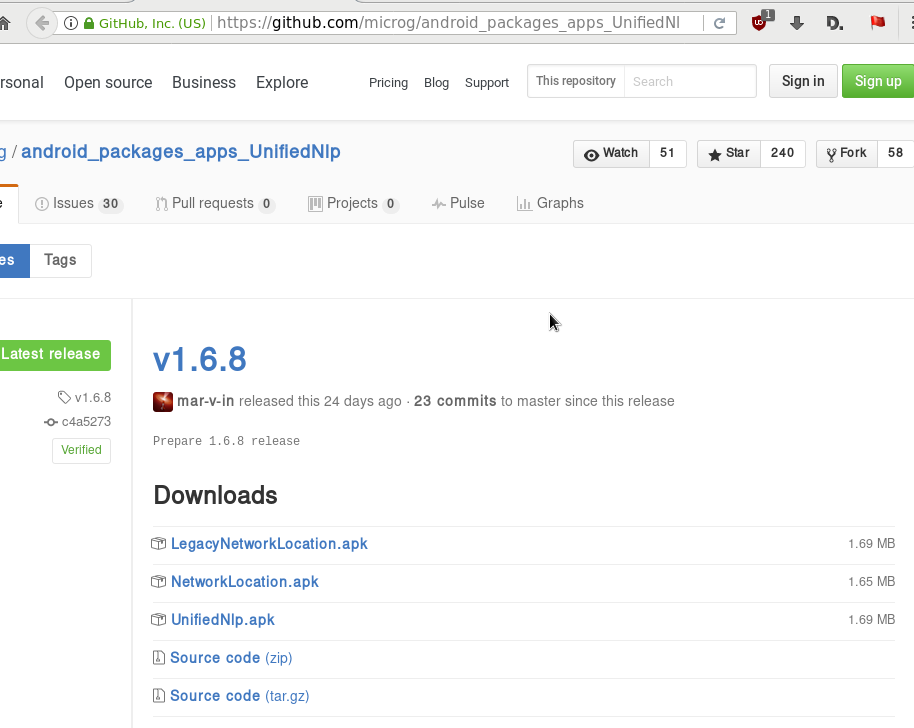
Google Play Store
So notes are referring to Phonesky … I didnt follow them !!!
Instead of phonesky, I installed BlankStore !
Here is the github repo: BlankStore v0.7.5
https://github.com/mar-v-in/BlankStore/releases
microG
Now are going to a more interesting part. We need to install the μG to our phone.
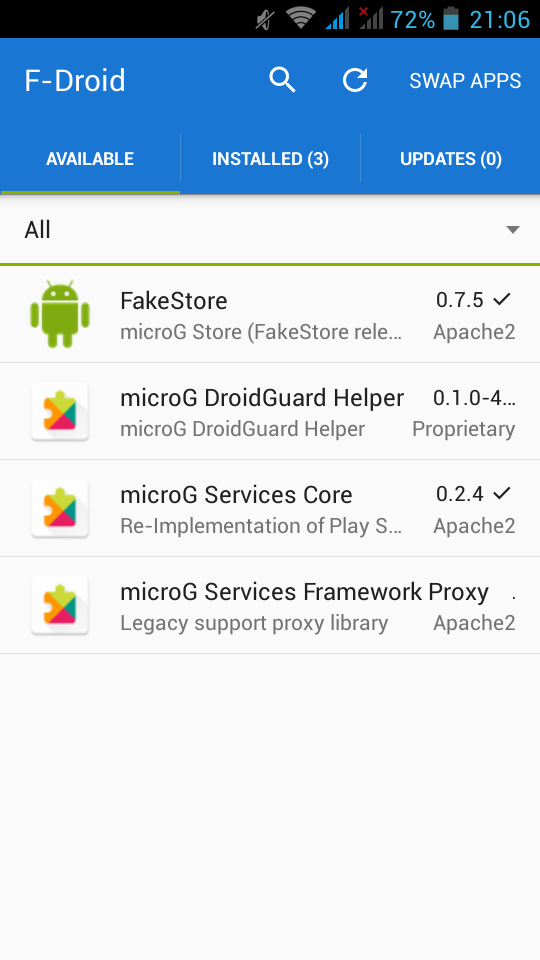
microG F-Droid repo
It’s really easy, just add the fdroid repository and install the below two apps:
https://microg.org/fdroid/repo?fingerprint=9BD06727E62796C0130EB6DAB39B73157451582CBD138E86C468ACC395D14165- microG Services Core
- microG Services Framework Proxy
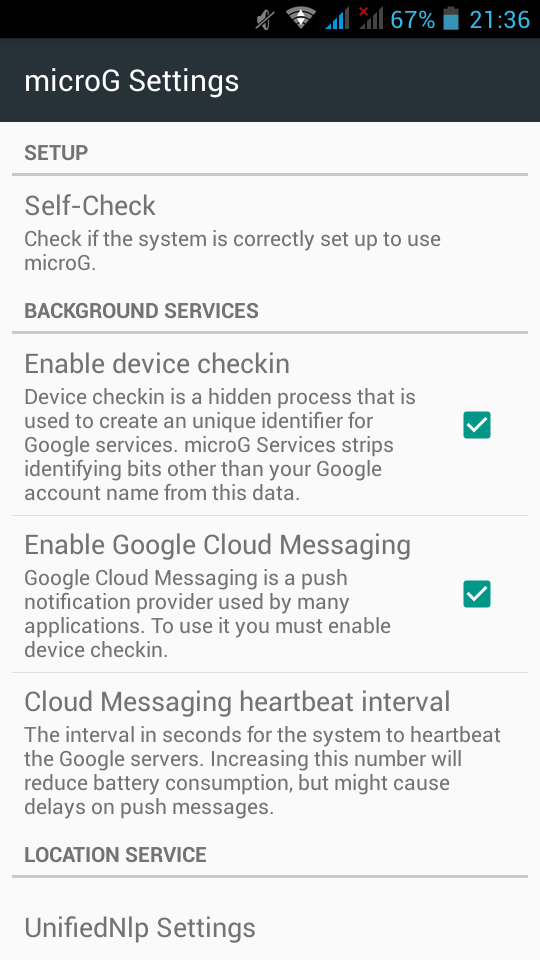
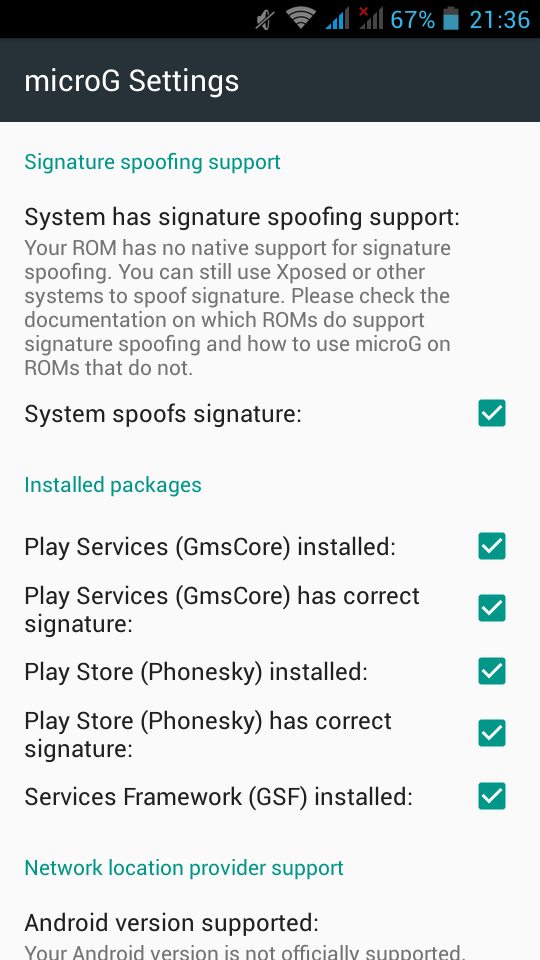
microG Services Core
Now the difficult part.
Opening microG self-checked, we are going to see that spoof signature is not passing the test.
Xposed
Now the most difficult and dangerous thing you will need to do with your phone.
We need to install Xposed Installer
For Fairphone FP1U we need:
Package:  de.robv.android.xposed.installer
Version name:  2.7 experimental
Download: de.robv.android.xposed.installer_v33_36570c.apk (770.28 KB)
MD5: 36570c6fac687ffe08107e6a72bd3da7
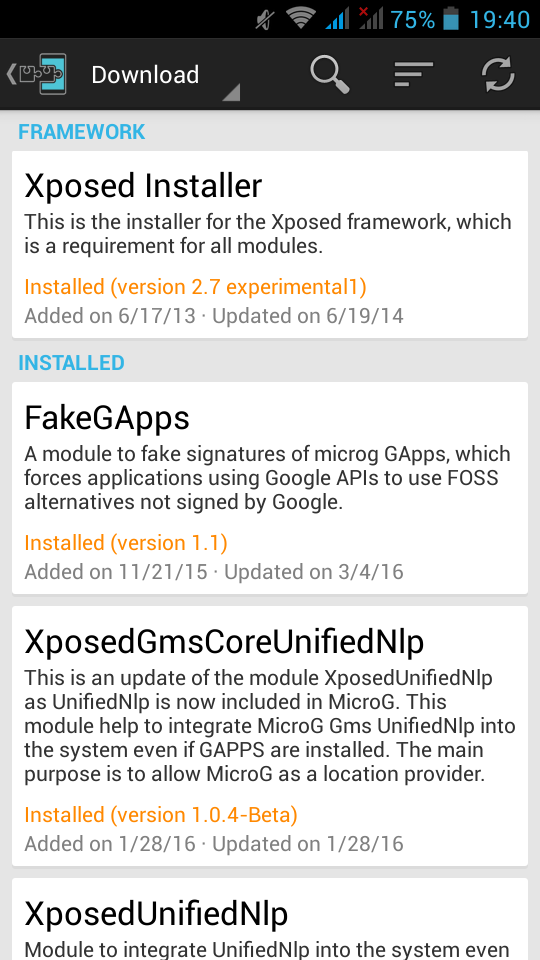
after that, we have to install the below xposed modules:
- Xposed Installer
- FakeGApps
- XposedGmsCoreUnifiedNlp
- XposedUnifiedNlp
download them and reboot your phone. If you think it may be helpful, cross your fingers.
This is a good time to remind you that you need to have a fresh backup
microG
Now let’s reboot our mobile phone again and try to open μG once more:
If everything seems like the above pictures, then you are done !
Errata 20170211
For android users with v4.2 on it, there are a few errata!
Location Services
You need the legacy network location package from UnifiedNlp
LegacyNetworkLocation.apkμG - microG
The latest online version -somehow- doesnt work with my phone perfectly.
You can use the build from BRNmod an alternative CyanogenMod
https://files.brnmod.rocks/apps/GmsCore/Latest/

play-services-core-debug.apk 27-Jan-2017 11:22 4188872Baikal
Almost a year ago, I wrote an article on how to install & use your personal Contact and Calendar Server & Android Client: Baïkal - CalDAV & CardDAV server
So, here are my personal notes on upgrading to it’s latest version (v0.4.6):
Github - Version
Here are the latest releases of baikal: Baikal Releases
Download
move to your baikal installation folder and download the latest version:
~> wget -c https://github.com/fruux/Baikal/releases/download/0.4.6/baikal-0.4.6.zip
Backup
Before doing anything else, keep a local backup of your previous installation:
~> tar cvf baikal.2016-03-26.tar baikalUncompress - Upgrade
To upgrade baikal is really, really easy.
You just need to uncompress the above dot zip file:
With -l you can see/list the files without uncompress them to your folder:
~> unzip -l baikal-0.4.6.zip | head
Archive:  baikal-0.4.6.zip
  Length      Date    Time    Name
---------  ---------- -----   ----
        0  08-19-2016 16:09   baikal/
        0  08-19-2016 16:09   baikal/Specific/
        0  08-19-2016 16:09   baikal/Specific/db/
        0  08-19-2016 16:09   baikal/Specific/db/.empty
        0  08-19-2016 15:50   baikal/html/
        0  08-19-2016 15:50   baikal/html/res/
        0  02-04-2016 09:15   baikal/html/res/core/
ok, we are sure:
~> unzip baikal-0.4.6.zip
Ownership
Change the ownership to your web browser user:
~> chown -R apache:apache baikalAdmin
Now you just need to open the admin interface to finish up the upgrade:
https://baikal.example.com/html/admin/

Iterators
In recent versions of PHP, there is an iterator that you can use for recursively go through a directory. The name of this iterator is RecursiveDirectoryIterator and below is a simple test use:
  1 <?php
  2
  3     $Contentpath = realpath('/tmp/');
  4     $Directory = new RecursiveDirectoryIterator($Contentpath);
  5     $Iterator  = new RecursiveIteratorIterator($Directory);
  6
  7     foreach($Iterator as $name => $object){
  8         echo "$name\n";
  9     }
 10
 11 ?>
the result is something like this:
# php test.php
/tmp/.
/tmp/..
/tmp/sess_td0p1cuohquk966fkit13fhi36
/tmp/sess_et3360aidupdnnifct0te2kr31
/tmp/sess_44rrgbn1em051u64bm49c6pmd2
/tmp/sess_42f9e0mhps120a72kco9nsbn81
/tmp/fresh.log
/tmp/.ICE-unix/.
/tmp/.ICE-unix/..
Filter
One of the benefits of this iterator, is that you can extend the RecursiveFilterIterator class to filter out unwanted values. Here is an example of the extend:
<?php
    $Contentpath = realpath('./');
    $Directory = new RecursiveDirectoryIterator($Contentpath);

    class MyRecursiveFilterIterator extends RecursiveFilterIterator {
        public function accept() {
            return $this->current()->getFilename();
        }
    }

    $MyFilter  = new MyRecursiveFilterIterator($Directory);
    $Iterator  = new RecursiveIteratorIterator($MyFilter);

    foreach($Iterator as $name => $object){
        echo "$name\n";
    }

?>
at the above example, we did not exclude or filter anything.
But our RecursiveIteratorIterator is now passing through our MyRecursiveFilterIterator !
TXT
Let’s filter out everything, but text files.
  1 <?php
  2     $Contentpath = realpath('./');
  3     $Directory = new RecursiveDirectoryIterator($Contentpath);
  4
  5     class MyRecursiveFilterIterator extends RecursiveFilterIterator {
  6         public function accept() {
  7             $file_parts = pathinfo($this->current()->getFilename());
  8
  9             if ( $file_parts['extension'] == 'txt' ) {
 10                 return $this->current()->getFilename();
 11             }
 12
 13         }
 14     }
 15
 16     $MyFilter = new MyRecursiveFilterIterator($Directory);
 17     $Iterator = new RecursiveIteratorIterator($MyFilter);
 18
 19     foreach($Iterator as $name => $object){
 20         echo "$name\n";
 21     }
 22 ?>
There is a little caveat on the above example !
Seems that the above piece of code is working just fine for a specific directory, but when you are running it against a recursive directory, you are going to have errors like the below one:
PHP Notice: Undefined index: extension
and that’s why pathinfo will also run against directories !!!
Directories
So, we need to exclude - filter out all the directories:
  1 <?php
  2     $Contentpath = realpath('./');
  3     $Directory = new RecursiveDirectoryIterator($Contentpath);
  4
  5     class MyRecursiveFilterIterator extends RecursiveFilterIterator {
  6         public function accept() {
  7
  8             if ( $this->current()->isDir() )
  9                 return true;
 10
 11              $file_parts = pathinfo($this->current()->getFilename());
 12
 13             if ( $file_parts['extension'] == 'txt' ) {
 14                 return $this->current()->getFilename();
 15             }
 16
 17         }
 18     }
 19
 20     $MyFilter = new MyRecursiveFilterIterator($Directory);
 21     $Iterator = new RecursiveIteratorIterator($MyFilter);
 22
 23     foreach($Iterator as $name => $object){
 24         echo "$name\n";
 25     }
 26 ?>
pretty close.
Dots
Pretty close indeed, but we are not excluding the DOT directories:
.
..
FilesystemIterator
From the FilesystemIterator class we learn that there is a flag that does that:
const integer SKIP_DOTS = 4096 ;and you can use it on RecursiveDirectoryIterator as the recursive directory iterator is actually an extend of FilesystemIterator
RecursiveDirectoryIterator extends FilesystemIterator implements SeekableIterator , RecursiveIterator so our code is transforming to this one:
  1 <?php
  2     $Contentpath = realpath('./');
  3     $Directory = new RecursiveDirectoryIterator($Contentpath,RecursiveDirectoryIterator::SKIP_DOTS);
  4
  5     class MyRecursiveFilterIterator extends RecursiveFilterIterator {
  6         public function accept() {
  7
  8             if ( $this->current()->isDir() )
  9                 return true;
 10
 11             $file_parts = pathinfo($this->current()->getFilename());
 12
 13             if ( $file_parts['extension'] == 'txt' ) {
 14                 return $this->current()->getFilename();
 15             }
 16
 17         }
 18     }
 19
 20     $MyFilter = new MyRecursiveFilterIterator($Directory);
 21     $Iterator = new RecursiveIteratorIterator($MyFilter);
 22
 23     foreach($Iterator as $name => $object){
 24         echo "$name\n";
 25     }
 26 ?>
That’s It !
ffmpeg is an amazing piece of software.
Today I had to create a small video of a few Print-Screens (Screenshots) and this is how I did it:
I’ve renamed all my screenshot png files from a datetime format in their names, into a numeric order.
Screenshot_2017-01-25_13-16-31.png  ---> Screenshot_01.png
Screenshot_2017-01-25_13-17-12.png  ---> Screenshot_02.png
...
after that everything was really easy:
~> ffmpeg -i Screenshot_%2d.png output.mp4
Be careful not to use * wildcard but %2d (two digits) for ffmpeg to iterate through all images.
If your images are something like: 001.png then use %3d (three digits) in your ffmpeg command.
The above command will show us 25 frames per seconds, so …. if you have less than 25 images, you will have a full second to see the entire video!!!
Delay
Now it’s time to add a duration delay:
~> ffmpeg -framerate 1/2 -i Screenshot_%2d.png -r 21 output.mp4
that means, convert 21 images with a 2 second delay into output.mp4 video
post inspired from:
https://kushaldas.in/posts/tools-i-use-daily.html
https://www.scrye.com/wordpress/nirik/2017/01/05/tools-i-use-daily/
Operating System
I use Archlinux as my primary Operating System. I am currently running Archlinux (since 2009) in all my boxes (laptop/workpc/homepc/odroid-c1). In the data center, I have CentOS on the bare-metal, and CentOS in the VM(s). A windows VM exists for work purposes on my workpc.
Desktop
The last few years I am running fluxbox but I used to work on xfce. Thunar (xfce-file browser) is my first and only choice and lilyterm as my terminal emulator. tmux as my multiplexer. I used to run gnu screen for a decade !
I use arand for desktop layout (sharing my screen to external monitor or the TV).
Disk / FileSystem
All my disks are encrypted and I use both ext4 and btrfs on my systems. I really like btrfs (subvolumes) and I use the raid-0 and raid-1 but no raid-5 or raid-6 yet. I also have LVM on my laptop as I can not change the ssd easy.
Mostly Thunderbird but I still use mutt when using a terminal or an ssh session.
Editor + IDE
Vim 99% of my time.
for short-time notes: mousepad and when feeling to use a GUI, I use geany.
Browser
Multiple Instances of firefox, chromium, firefox - Nightly, Tor Browser and vimprobable2. I used to run midori but I’ve dropped it. I also have multiple profiles on firefox !!! I keep private-mode or incognito, all of them via a socks proxy (even Tor-Browser) with remote DNS (when possible).
IRC
Nope
but when needed, smuxi or pidgin
Blog / Website
flatpress no database, static pages but dynamic framework written in PHP. Some custom code on it but I keep a separated (off-the-web) clone with my custom changes. Recently added Markdown support and some JavaScript for code highlighting etc.
I dont tend to write a lot, but I keep personal notes on drafts (unpublished). I also keep a (wackowiki) wiki as a personal online keeping-notes wiki on my domain.
Version Control
Mostly mercurial but also git . I have a personal hg server (via ssh) for my code, files, notes, etc etc
Media
VLC only. For media and podcasts and mirage or feh for image display. gimp for image manipulation
Misc
Coffee
I wake up, I make my double espresso at home and drink it on commuting to work. The 20min distance gives coffee enough time to wake my brain. When at work, I mostly rant for everything.
and alcohol when needed ;)
PS:
My fluxbox menu has less than 15 apps, I’ve put there only my daily-use programs and I try to keep distractions on my desktop as minimum as possible. I keep disable notifications to apps and I mostly work on full screen to minimize input from running apps.
Elasticsearch, Logstash, Kibana or ELK Crash Course 101
Prologue aka Disclaimer
This blog post is the outcome of a Hackerspace Event:: Logstash Intro Course that happened a few days ago. I prefer doing workshops Vs presentations -as I pray to the Live-Coding Gods- and this is the actual workshop in bulletin notes.
Objectives
For our technical goal we will use my fail2ban !
We will figure (together) whom I ban with my fail2ban!!!
The results we want to present are:
| Date | IP | Country |
|---|
To help you with this inquiry, we will use this dataset: fail2ban.gz
If you read though this log you will see that it’s a grep from my messages logs.
So in the begging we have messages from compressed files … and in the end we have messages from uncompressed files.
But … Let’s begin with our journey !!
Prerequisite
For our little experiment we need Java
I Know, I know … not the beverage - the programming language !!
try java 1.7.x
# java -version
java version "1.7.0_111"
OpenJDK Runtime Environment (IcedTea 2.6.7) (Arch Linux build 7.u111_2.6.7-1-x86_64)
OpenJDK 64-Bit Server VM (build 24.111-b01, mixed mode)
In my archlinux machine:
# yes | pacman -S jdk7-openjdkVersions
As, October 26, 2016 all versions (logstash,elastic,kibana) are all in version 5.0.x and latests.
But we will try the well-known installed previous versions !!!
as from 5.0.x and later …. we have: Breaking changes and you will need Java 8
Download
Let’s download software
# wget -c https://download.elastic.co/logstash/logstash/logstash-2.4.1.zip

# wget -c https://download.elastic.co/elasticsearch/elasticsearch/elasticsearch-2.4.1.zip

# wget -c https://download.elastic.co/kibana/kibana/kibana-4.6.3-linux-x86_64.tar.gz
Logstash
Uncompress and test that logstash can run without a problem:
# unzip logstash-2.4.1.zip
# cd logstash-2.4.1

# logstash-2.4.1/
# ./bin/logstash --version
logstash 2.4.1

# ./bin/logstash --help
Basic Logstash Example
Reminder: Ctrl+c breaks the logstash
# ./bin/logstash -e 'input { stdin { } } output { stdout {} }'
We are now ready to type ‘Whatever’ and see what happens:
# ./bin/logstash -e 'input { stdin { } } output { stdout {} }'
Settings: Default pipeline workers: 4
Pipeline main started
whatever
2016-11-15T19:18:09.638Z myhomepc whatever
Ctrl + c
Ctrl + c
^CSIGINT received. Shutting down the agent. {:level=>:warn}
stopping pipeline {:id=>"main"}
Received shutdown signal, but pipeline is still waiting for in-flight events
to be processed. Sending another ^C will force quit Logstash, but this may cause
data loss. {:level=>:warn}
^CSIGINT received. Terminating immediately.. {:level=>:fatal}
Standard Input and Standard Output
In this first example the input is our standard input, that means keyboard
and standard output means our display.
We typed:
whateverand logstash reports:
2016-11-15T19:18:09.638Z myhomepc whatever
There are three (3) fields:
- timestamp : 2016-11-15T19:18:09.638Z
- hostname : myhomepc
- message : whatever
Logstash Architecture

Logstash architecture reminds me Von Neumann .
Input --> Process --> Output In Process we have filter plugins and in input pluggins & output plugins we have codec plugins
Codec plugins
We can define the data representation (logs or events) via codec plugins. Most basic codec plugin is: rubydebug
rubydebug
eg. logstash -e ‘input { stdin { } } output { stdout { codec => rubydebug} }’
# ./bin/logstash -e 'input { stdin { } } output { stdout { codec => rubydebug} }'
Settings: Default pipeline workers: 4
Pipeline main started

whatever

{
       "message" => "whatever",
      "@version" => "1",
    "@timestamp" => "2016-11-15T19:40:46.070Z",
          "host" => "myhomepc"
}

^CSIGINT received. Shutting down the agent. {:level=>:warn}
stopping pipeline {:id=>"main"}
^CSIGINT received. Terminating immediately.. {:level=>:fatal}
json
Let’s try the json codec plugin, but now we will try it via a linux pipe:
# echo whatever | ./bin/logstash -e 'input { stdin { } } output { stdout { codec => json }  }'

Settings: Default pipeline workers: 4
Pipeline main started

{"message":"whatever","@version":"1","@timestamp":"2016-11-15T19:48:44.127Z","host":"myhomepc"}

Pipeline main has been shutdown
stopping pipeline {:id=>"main"}
json_lines
# echo -e 'whatever1nwhatever2nn' | ./bin/logstash -e 'input { stdin { } } output { stdout { codec => json_lines }  }'

Settings: Default pipeline workers: 4
Pipeline main started

{"message":"whatever1","@version":"1","@timestamp":"2016-11-15T19:50:12.311Z","host":"myhomepc"}
{"message":"whatever2","@version":"1","@timestamp":"2016-11-15T19:50:12.324Z","host":"myhomepc"}

Pipeline main has been shutdown
stopping pipeline {:id=>"main"}
List of codec
Here is the basic list of codec:
avro
cef
compress_spooler
cloudtrail
cloudfront
collectd
dots
edn_lines
edn
es_bulk
fluent
gzip_lines
graphite
json_lines
json
line
msgpack
multiline
netflow
nmap
oldlogstashjson
plain
rubydebug
s3_plain
Configuration File
It is now very efficient to run everything from the command line, so we will try to move to a configuration file:
logstash.conf
input {
    stdin { }
}

output {
    stdout {
        codec => rubydebug
    }
}
and run the above example once more:
# echo -e 'whatever1nwhatever2' | ./bin/logstash -f logstash.conf

Settings: Default pipeline workers: 4
Pipeline main started

{
       "message" => "whatever1",
      "@version" => "1",
    "@timestamp" => "2016-11-15T19:59:51.146Z",
          "host" => "myhomepc"
}
{
       "message" => "whatever2",
      "@version" => "1",
    "@timestamp" => "2016-11-15T19:59:51.295Z",
          "host" => "myhomepc"
}

Pipeline main has been shutdown
stopping pipeline {:id=>"main"}
Config Test
Every time you need to test your configuration file for syntax check:
./bin/logstash --configtest

Configuration OK
fail2ban - logstash 1st try
Now it’s time to test our fail2ban file against our logstash setup. To avoid the terror of 22k lines, we will test the first 10 lines to see how it works:
# head ../fail2ban | ./bin/logstash -f logstash.conf
Settings: Default pipeline workers: 4
Pipeline main started

{
       "message" => "messages-20160918.gz:Sep 11 09:13:13 myhostname fail2ban.actions[1510]: NOTICE [apache-badbots] Unban 93.175.200.191",
      "@version" => "1",
    "@timestamp" => "2016-11-15T20:10:40.784Z",
          "host" => "myhomepc"
}
{
       "message" => "messages-20160918.gz:Sep 11 09:51:08 myhostname fail2ban.actions[1510]: NOTICE [apache-badbots] Unban 186.125.190.156",
      "@version" => "1",
    "@timestamp" => "2016-11-15T20:10:40.966Z",
          "host" => "myhomepc"
}
{
       "message" => "messages-20160918.gz:Sep 11 11:51:24 myhostname fail2ban.filter[1510]: INFO [apache-badbots] Found 37.49.225.180",
      "@version" => "1",
    "@timestamp" => "2016-11-15T20:10:40.967Z",
          "host" => "myhomepc"
}
{
       "message" => "messages-20160918.gz:Sep 11 11:51:24 myhostname fail2ban.actions[1510]: NOTICE [apache-badbots] Ban 37.49.225.180",
      "@version" => "1",
    "@timestamp" => "2016-11-15T20:10:40.968Z",
          "host" => "myhomepc"
}
{
       "message" => "messages-20160918.gz:Sep 11 14:58:35 myhostname fail2ban.filter[1510]: INFO [postfix-sasl] Found 185.40.4.126",
      "@version" => "1",
    "@timestamp" => "2016-11-15T20:10:40.968Z",
          "host" => "myhomepc"
}
{
       "message" => "messages-20160918.gz:Sep 11 14:58:36 myhostname fail2ban.actions[1510]: NOTICE [postfix-sasl] Ban 185.40.4.126",
      "@version" => "1",
    "@timestamp" => "2016-11-15T20:10:40.969Z",
          "host" => "myhomepc"
}
{
       "message" => "messages-20160918.gz:Sep 11 15:03:08 myhostname fail2ban.filter[1510]: INFO [apache-fakegooglebot] Ignore 66.249.69.88 by command",
      "@version" => "1",
    "@timestamp" => "2016-11-15T20:10:40.970Z",
          "host" => "myhomepc"
}
{
       "message" => "messages-20160918.gz:Sep 11 15:03:08 myhostname fail2ban.filter[1510]: INFO [apache-fakegooglebot] Ignore 66.249.76.55 by command",
      "@version" => "1",
    "@timestamp" => "2016-11-15T20:10:40.970Z",
          "host" => "myhomepc"
}
{
       "message" => "messages-20160918.gz:Sep 11 15:26:04 myhostname fail2ban.filter[1510]: INFO [apache-fakegooglebot] Ignore 66.249.76.53 by command",
      "@version" => "1",
    "@timestamp" => "2016-11-15T20:10:40.971Z",
          "host" => "myhomepc"
}
{
       "message" => "messages-20160918.gz:Sep 11 17:01:02 myhostname fail2ban.filter[1510]: INFO [apache-badbots] Found 93.175.200.191",
      "@version" => "1",
    "@timestamp" => "2016-11-15T20:10:40.971Z",
          "host" => "myhomepc"
}

Pipeline main has been shutdown
stopping pipeline {:id=>"main"}
fail2ban - filter
As we said in the begging of our journey, we want to check what IPs I Ban with fail2ban !!
So we need to filter the messages. Reading through our dataset, we will soon find out that we need lines like:
"messages-20160918.gz:Sep 11 11:51:24 myhostname fail2ban.actions[1510]: NOTICE [apache-badbots] Ban 37.49.225.180"so we could use an if-statement (conditional statements).
fail2ban - Conditionals
You can use the following comparison operators:

    equality: ==, !=, <, >, <=, >=
    regexp: =~, !~ (checks a pattern on the right against a string value on the left)
    inclusion: in, not in

The supported boolean operators are:

    and, or, nand, xor

The supported unary operators are:

    !

Expressions can be long and complex.
fail2ban - message filter
With the above knowledge, our logstash configuration file can now be:
logstash.conf
input {
    stdin { }
}

filter {
    if [message]  !~ ' Ban ' {
        drop { }
    }
}

output {
    stdout {
        codec => rubydebug
    }
}
and the results:
# head ../fail2ban | ./bin/logstash -f logstash.conf -v

{
       "message" => "messages-20160918.gz:Sep 11 11:51:24 myhostname fail2ban.actions[1510]: NOTICE [apache-badbots] Ban 37.49.225.180",
      "@version" => "1",
    "@timestamp" => "2016-11-15T20:33:39.858Z",
          "host" => "myhomepc"
}
{
       "message" => "messages-20160918.gz:Sep 11 14:58:36 myhostname fail2ban.actions[1510]: NOTICE [postfix-sasl] Ban 185.40.4.126",
      "@version" => "1",
    "@timestamp" => "2016-11-15T20:33:39.859Z",
          "host" => "myhomepc"
}
but we are pretty far away from our goal.
The above approach is just fine for our example, but it is far away from perfect or even elegant !
And here is way: the regular expression ‘ Ban ‘ is just that, a regular expression.
The most elegant approach is to match the entire message and drop everything else. Then we could be most certain sure about the output of the logs.
grok
And here comes grok !!!
and to do that we must learn the grok:
Parses unstructured event data into fieldsthat would be extremely useful. Remember, we have a goal!
We dont need everything, we need the date, ip & country !!
Grok Patterns
grok work with patterns, that follows the below generic rule:
%{SYNTAX:SEMANTIC}
You can use the online grok debugger: grok heroku
to test your messages/logs/events against grok patterns
If you click on the left grok-patterns you will see the most common grok patterns.
In our setup:
# find . -type d -name patterns
./vendor/bundle/jruby/1.9/gems/logstash-patterns-core-2.0.5/lib/logstash/patterns
./vendor/bundle/jruby/1.9/gems/logstash-patterns-core-2.0.5/patterns
the latest directory is where our logstansh instance keeps the default grok patterns.
To avoid the suspense … here is the full grok pattern:
messages%{DATA}:%{SYSLOGTIMESTAMP} %{HOSTNAME} %{SYSLOGPROG}: %{LOGLEVEL} [%{PROG}] Ban %{IPV4}grok - match
If you run this new setup, we will see something peculiar:
logstash.conf
input {
    stdin { }
}

filter {

#    if [message]  !~ ' Ban ' {
#        drop { }
#    }

    grok {
        match => {
            "message" => "messages%{DATA}:%{SYSLOGTIMESTAMP} %{HOSTNAME} %{SYSLOGPROG}: %{LOGLEVEL} [%{PROG}] Ban %{IPV4}"
        }
    }
}

output {
    stdout {
        codec => rubydebug
    }
}
We will get messages like these:
{
       "message" => "messages:Nov 15 17:49:09 myhostname fail2ban.actions[1585]: NOTICE [apache-fakegooglebot] Ban 66.249.76.67",
      "@version" => "1",
    "@timestamp" => "2016-11-15T21:30:29.345Z",
          "host" => "myhomepc",
       "program" => "fail2ban.actions",
           "pid" => "1585"
}
{
       "message" => "messages:Nov 15 17:49:31 myhostname fail2ban.action[1585]: ERROR /etc/fail2ban/filter.d/ignorecommands/apache-fakegooglebot 66.249.76.104 -- stdout: ''",
      "@version" => "1",
    "@timestamp" => "2016-11-15T21:30:29.346Z",
          "host" => "myhomepc",
          "tags" => [
        [0] "_grokparsefailure"
    ]
}
It match some of them and the all the rest are tagged with grokparsefailure
We can remove them easily:
logstash.conf
input {
    stdin { }
}

filter {

#    if [message]  !~ ' Ban ' {
#        drop { }
#    }

    grok {
        match => {
            "message" => "messages%{DATA}:%{SYSLOGTIMESTAMP} %{HOSTNAME} %{SYSLOGPROG}: %{LOGLEVEL} [%{PROG}] Ban %{IPV4}"
        }
    }

    if "_grokparsefailure" in [tags] {
        drop { }
    }
}

output {
    stdout {
        codec => rubydebug
    }
}
Using colon (:) character on SYNTAX grok pattern is a new field for grok / logstash.
So we can change a little bit the above grok pattern to this:
messages%{DATA}:%{SYSLOGTIMESTAMP} %{HOSTNAME} %{PROG}(?:[%{POSINT}])?: %{LOGLEVEL} [%{PROG}] Ban %{IPV4}but then again, we want to filter some fields, like the date and IP, so
messages%{DATA}:%{SYSLOGTIMESTAMP:date} %{HOSTNAME} %{PROG}(?:[%{POSINT}])?: %{LOGLEVEL} [%{PROG}] Ban %{IPV4:ip}logstash.conf
input {
    stdin { }
}

filter {

#    if [message]  !~ ' Ban ' {
#        drop { }
#    }

    grok {
        match => {
            "message" => "messages%{DATA}:%{SYSLOGTIMESTAMP:date} %{HOSTNAME} %{PROG}(?:[%{POSINT}])?: %{LOGLEVEL} [%{PROG}] Ban %{IPV4:ip}"
        }
    }

    if "_grokparsefailure" in [tags] {
        drop { }
    }
}

output {
    stdout {
        codec => rubydebug
    }
}
output will be like this:
       "message" => "messages:Nov 15 17:49:32 myhostname fail2ban.actions[1585]: NOTICE [apache-fakegooglebot] Ban 66.249.76.104",
      "@version" => "1",
    "@timestamp" => "2016-11-15T21:42:21.260Z",
          "host" => "myhomepc",
          "date" => "Nov 15 17:49:32",
            "ip" => "66.249.76.104"
}
grok - custom pattern
If we want to match something specific with to a custom grok pattern, we can simple add one!
For example, we want to match Ban and Unban action:
# vim ./vendor/bundle/jruby/1.9/gems/logstash-patterns-core-2.0.5/patterns/ebalACTION (Ban|Unban)and then our grok matching line will transform to :
logstash.conf
input {
    stdin { }
}

filter {

#    if [message]  !~ ' Ban ' {
#        drop { }
#    }

    grok {
        match => {
#            "message" => "messages%{DATA}:%{SYSLOGTIMESTAMP:date} %{HOSTNAME} %{PROG}(?:[%{POSINT}])?: %{LOGLEVEL} [%{PROG}] Ban %{IPV4:ip}"
            "message" => "messages%{DATA}:%{SYSLOGTIMESTAMP:date} %{HOSTNAME} %{PROG}(?:[%{POSINT}])?: %{LOGLEVEL} [%{PROG}] %{ACTION:action} %{IPV4:ip}"
        }
    }

    if "_grokparsefailure" in [tags] {
        drop { }
    }
}

output {
    stdout {
        codec => rubydebug
    }
}
output:
{
       "message" => "messages:Nov 15 18:13:53 myhostname fail2ban.actions[1585]: NOTICE [apache-badbots] Unban 41.82.165.220",
      "@version" => "1",
    "@timestamp" => "2016-11-15T21:53:59.634Z",
          "host" => "myhomepc",
          "date" => "Nov 15 18:13:53",
        "action" => "Unban",
            "ip" => "41.82.165.220"
}
mutate
We are getting pretty close … the most difficult part is over (grok patterns).
Just need to remove any exta fields. We can actually do that with two ways:
- grok - remove_field
- mutate -remove_field
We’ll try mutate cause is more powerful.
And for our example/goal we will not use any custom extra Action field, so:
logstash.conf
input {
    stdin { }
}

filter {

#    if [message]  !~ ' Ban ' {
#        drop { }
#    }

    grok {
        match => {
            "message" => "messages%{DATA}:%{SYSLOGTIMESTAMP:date} %{HOSTNAME} %{PROG}(?:[%{POSINT}])?: %{LOGLEVEL} [%{PROG}] Ban %{IPV4:ip}"
#            "message" => "messages%{DATA}:%{SYSLOGTIMESTAMP:date} %{HOSTNAME} %{PROG}(?:[%{POSINT}])?: %{LOGLEVEL} [%{PROG}] %{ACTION:action} %{IPV4:ip}"
        }
    }

    if "_grokparsefailure" in [tags] {
        drop { }
    }
    mutate {
        remove_field => [ "message", "@version", "@timestamp", "host" ]
    }
}

output {
    stdout {
        codec => rubydebug
    }
}
results:
{
    "date" => "Nov 15 17:49:32",
      "ip" => "66.249.76.104"
}
so close !!!
mutate - replace
According to syslog RFC (request for comments) [RFC 3164 - RFC 3195]:
In particular, the timestamp has a year, making it a nonstandard formatso most of logs doesnt have a YEAR on their timestamp !!!
Logstash can add an extra field or replace an existing field :
logstash.conf
input {
    stdin { }
}

filter {

#    if [message]  !~ ' Ban ' {
#        drop { }
#    }

    grok {
        match => {
            "message" => "messages%{DATA}:%{SYSLOGTIMESTAMP:date} %{HOSTNAME} %{PROG}(?:[%{POSINT}])?: %{LOGLEVEL} [%{PROG}] Ban %{IPV4:ip}"
#            "message" => "messages%{DATA}:%{SYSLOGTIMESTAMP:date} %{HOSTNAME} %{PROG}(?:[%{POSINT}])?: %{LOGLEVEL} [%{PROG}] %{ACTION:action} %{IPV4:ip}"
        }
    }

    if "_grokparsefailure" in [tags] {
        drop { }
    }
    mutate {
        remove_field => [ "message", "@version", "@timestamp", "host" ]
        replace => { date => "%{+YYYY} %{date}" }
    }
}

output {
    stdout {
        codec => rubydebug
    }
}
the output:
{
    "date" => "2016 Nov 15 17:49:32",
      "ip" => "66.249.76.104"
}
GeoIP
The only thing that is missing from our original goal, is the country field!
Logstash has a geoip plugin that works perfectly with MaxMind
So we need to download the GeoIP database:
# wget -N http://geolite.maxmind.com/download/geoip/database/GeoLiteCountry/GeoIP.dat.gz
The best place is to put this file (uncompressed) under your logstash directory.
Now, it’s time to add the geoip support to the logstash.conf :
  # Add Country Name
  # wget -N http://geolite.maxmind.com/download/geoip/database/GeoLiteCountry/GeoIP.dat.gz
  geoip {
    source => "ip"
    target => "geoip"
    fields => ["country_name"]
    database => "GeoIP.dat"
   # database => "/etc/logstash/GeoIP.dat"
  }
the above goes under the filter section of logstash conf file.
running the above configuration
# head ../fail2ban | ./bin/logstash -f logstash.confshould display something like this:
{
     "date" => "2016 Sep 11 11:51:24",
       "ip" => "37.49.225.180",
    "geoip" => {
        "country_name" => "Netherlands"
    }
}
{
     "date" => "2016 Sep 11 14:58:36",
       "ip" => "185.40.4.126",
    "geoip" => {
        "country_name" => "Russian Federation"
    }
}
We are now pretty close to our primary objective.
rename
It would be nice to somehow translate the geoip –> country_name to something more useful, like Country.
That’s why we are going to use the rename setting under the mutate plugin:
  mutate {
    rename => { "[geoip][country_name]"  => "Country" }
  }
so let’s put all them together:
    geoip {
        source => "ip"
        target => "geoip"
        fields => ["country_name"]
        database => "GeoIP.dat"
    }

    mutate {
        rename => { "[geoip][country_name]"  => "Country" }
        remove_field => [ "message", "@version", "@timestamp", "host", "geoip"]
        replace => { date => "%{+YYYY} %{date}" }
    }
test run it and the output will show you something like that:
{
       "date" => "2016 Sep 11 11:51:24",
         "ip" => "37.49.225.180",
    "Country" => "Netherlands"
}
{
       "date" => "2016 Sep 11 14:58:36",
         "ip" => "185.40.4.126",
    "Country" => "Russian Federation"
}
hurray !!!
finally we have completed our primary objective.
Input - Output
Input File
Until now, you have been reading from the standard input, but it’s time to read from the file.
To do so, we must add the bellow settings under the input section:
file {
    path => "/var/log/messages"
    start_position => "beginning"
}
Testing our configuration file (without giving input from the command line):
./bin/logstash -f logstash.conf
and the output will be something like this:
{
       "path" => "/var/log/messages",
       "date" => "2016 Nov 15 17:49:09",
         "ip" => "66.249.76.67",
    "Country" => "United States"
}
{
       "path" => "/var/log/messages",
       "date" => "2016 Nov 15 17:49:32",
         "ip" => "66.249.76.104",
    "Country" => "United States"
}
so by changing the input from the standard input to a file path, we added a new extra filed.
The path
Just remove it with mutate –> remove_field as we already shown above
Output
Now it’s time to send everything to our elastic search engine:
output {

    # stdout {
    #    codec => rubydebug
    # }

    elasticsearch {
    }

}
Be Careful: In our above examples we have removed the timestamp field
but for the elasticsearch to work, we must enable it again:
remove_field => [ "message", "@version", "host", "geoip"]Elasticsearch
Uncompress and run elastic search engine:
# unzip elasticsearch-2.4.1.zip
# cd elasticsearch-2.4.1/
# ./bin/elasticsearch
elasticsearch is running under:
tcp6       0      0 127.0.0.1:9200          :::*                    LISTEN      27862/java
tcp6       0      0 127.0.0.1:9300          :::*                    LISTEN      27862/java
Impressive, but that’s it!
Status
Let’s find out if the elasticsearch engine is running:
$ curl 'localhost:9200/_cat/health?v'

$ curl -XGET 'http://localhost:9200/_cluster/health?pretty=true'

epoch      timestamp cluster       status node.total node.data shards pri relo init unassign pending_tasks max_task_wait_time active_shards_percent
1482421814 17:50:14  elasticsearch yellow          1         1      1   1    0    0        1             0                  -                 50.0%

$ curl 'localhost:9200/_cat/nodes?v'

host      ip        heap.percent ram.percent load node.role master name
127.0.0.1 127.0.0.1            7          98 0.50 d         *      Hazmat

# curl -s -XGET 'http://localhost:9200/_cluster/health?level=indices' | jq .
logstash
Now it’s time to send our data to our elastic search engine, running the logstash daemon with input the fail2ban file and output the elastic search.
Kibana
We are almost done. There is only one more step to our 101 course for ELK infrastructure.
And that is the kibana dashboard.
setup kibana
Uncompress and run the kibana dashboard:
 tar xf kibana-4.6.3-linux-x86_64.tar.gz
 ./bin/kibana
dashboard
Now simply, open the kibana dashboard on:
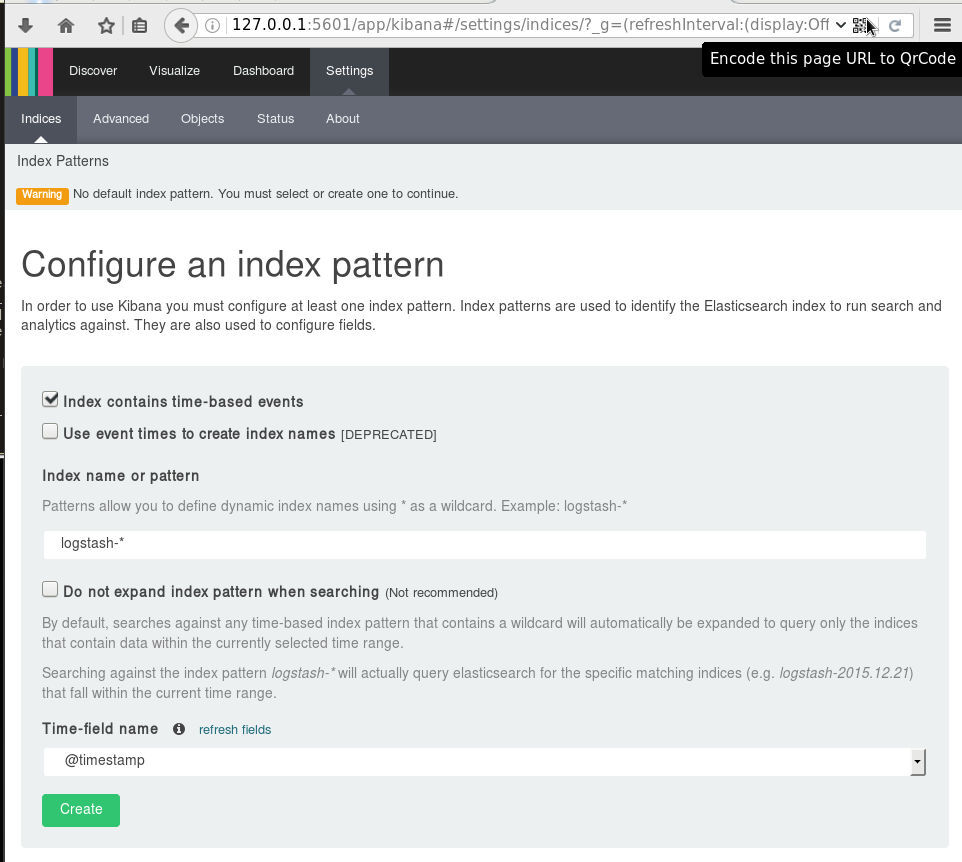
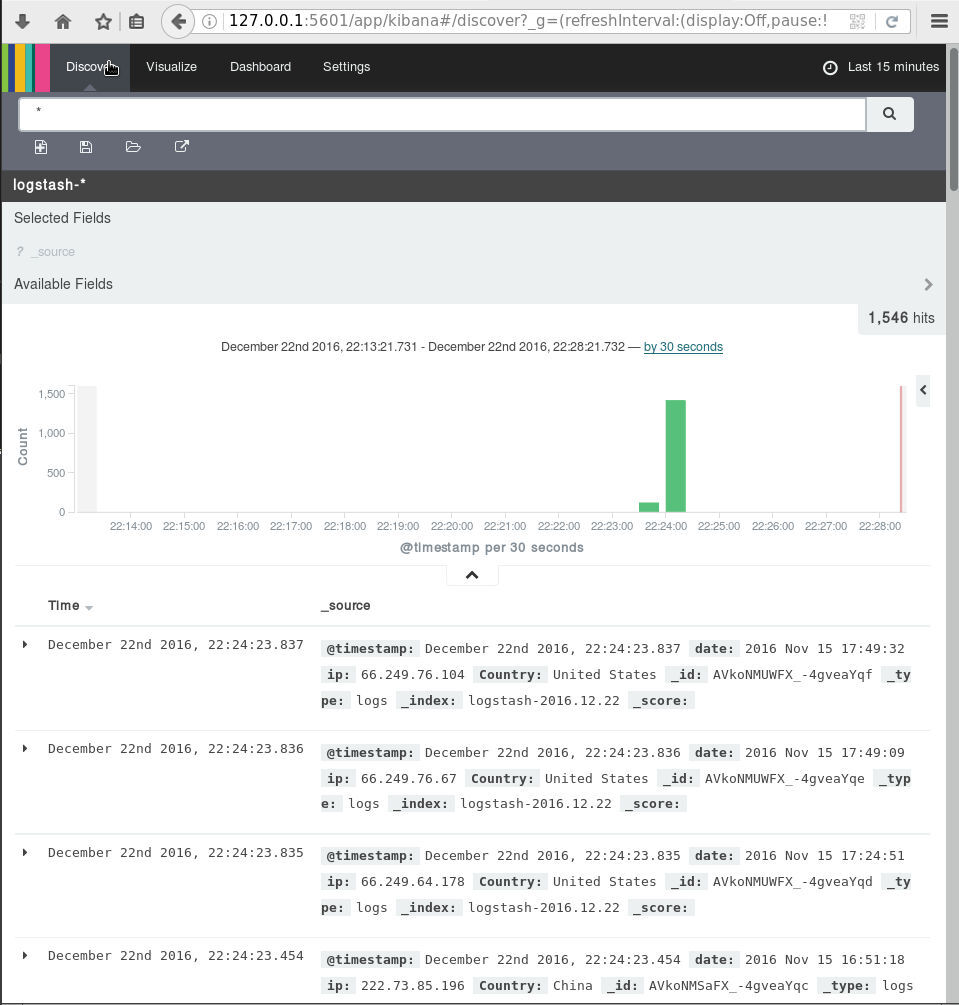
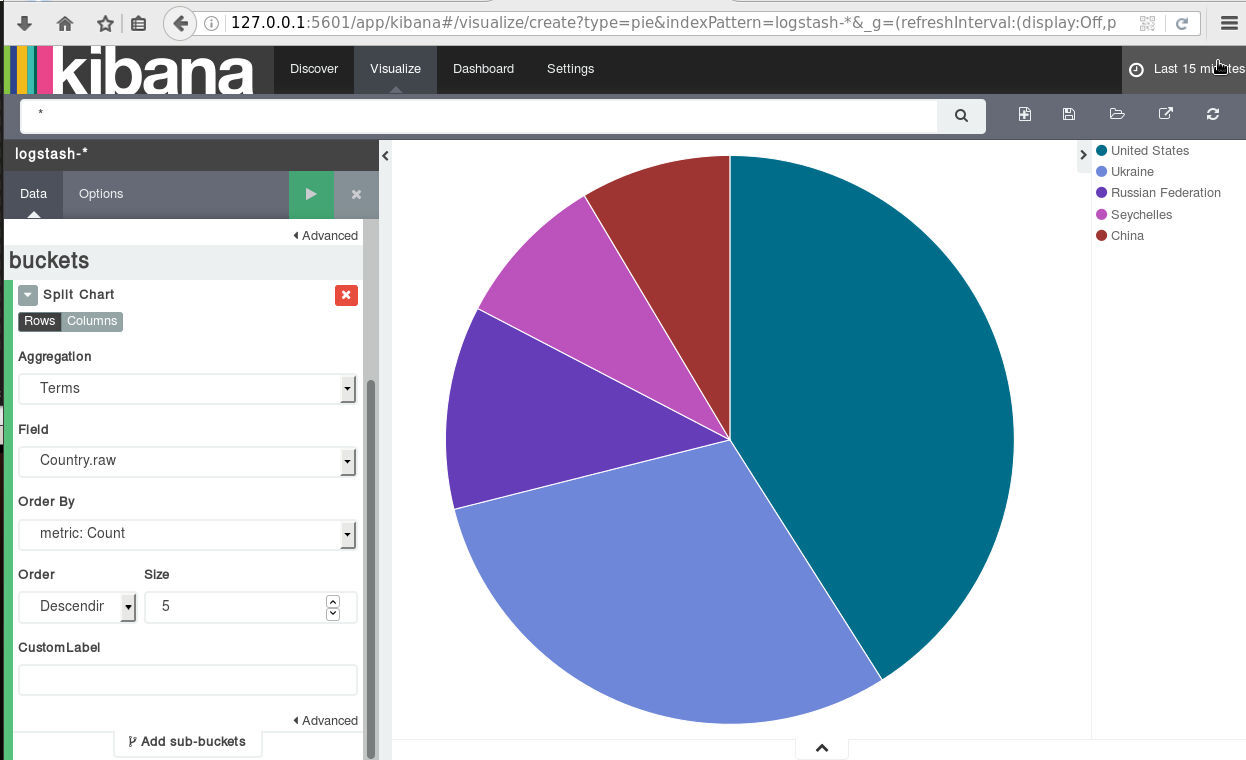
A visual guide on how to enlarge your windows disk image aka windows extend volume
I have a windows 10 qemu-kvm virtual machine for business purposes.
Every now and then, I have to resize it’s disk image!
This is my visual guide, so next time I will not waste any time figure this out, again!
Resize Disk image
The first step is to resize the disk image from the command line:
# ls -l win10.qcow2
-rw-r--r-- 1 root root 58861813760 Nov 17 10:04 win10.qcow2

# du -h win10.qcow2
55G win10.qcow2

#  qemu-img info win10.qcow2
image: win10.qcow2
file format: qcow2
virtual size: 55G (59055800320 bytes)
disk size: 55G
cluster_size: 65536
Format specific information:
    compat: 1.1
    lazy refcounts: false
    refcount bits: 16
    corrupt: false
#  qemu-img resize win10.qcow2 +10G
Image resized.
# qemu-img info win10.qcow2
image: win10.qcow2
file format: qcow2
virtual size: 65G (69793218560 bytes)
disk size: 55G
cluster_size: 65536
Format specific information:
    compat: 1.1
    lazy refcounts: false
    refcount bits: 16
    corrupt: false
Windows Problem - extend volume
Windows can not extend a volume if the free partition is not next to the “need-to-be” extened volume.
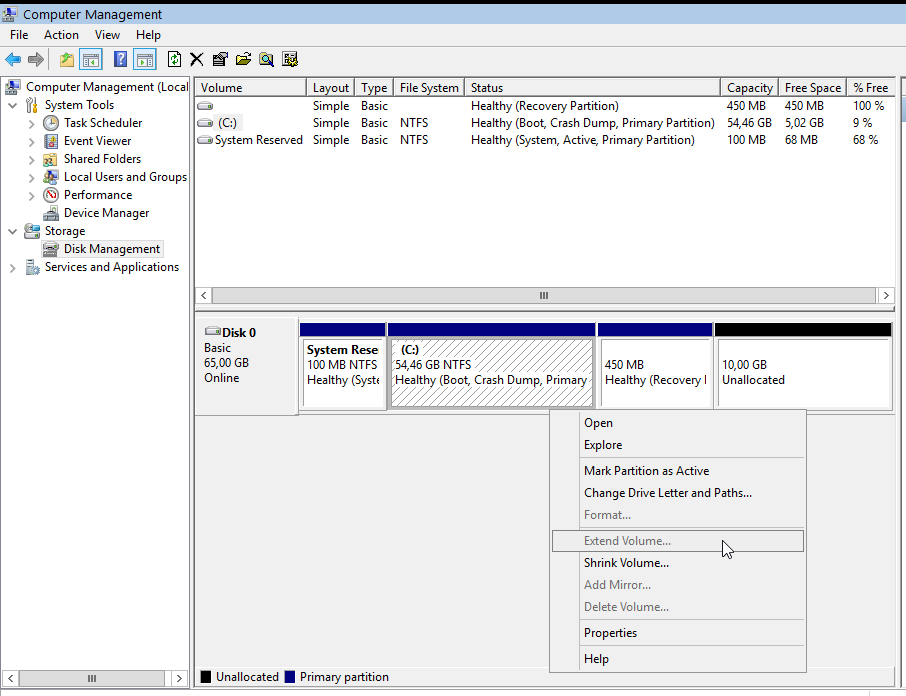
So we have to move the free partition next to C: drive
System Rescue Cd
Here comes system rescue cd !
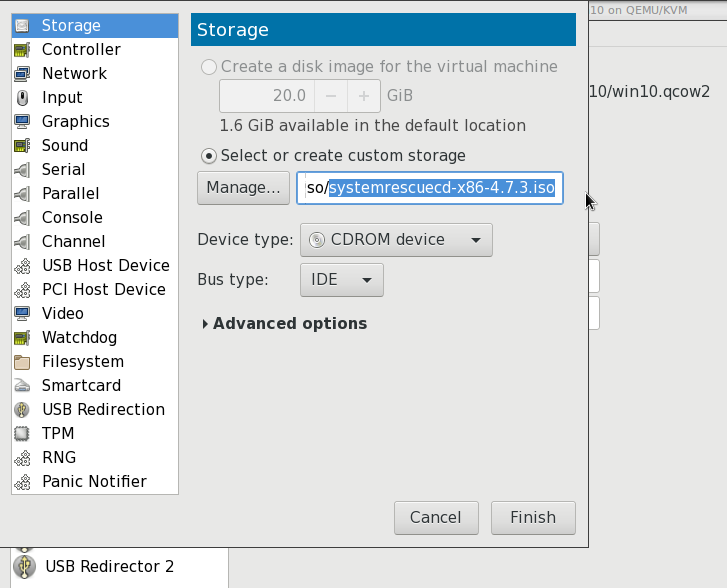
Gparted
with gparted you can move to the end of the virtual disk the ntfs recovery partition:
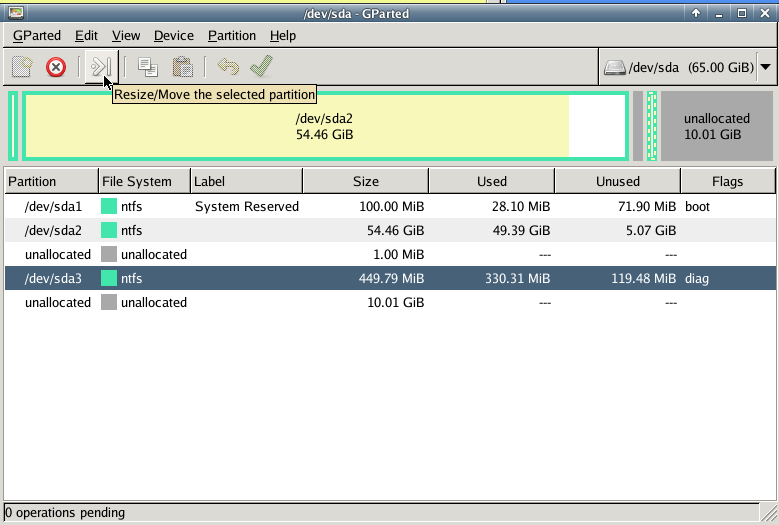
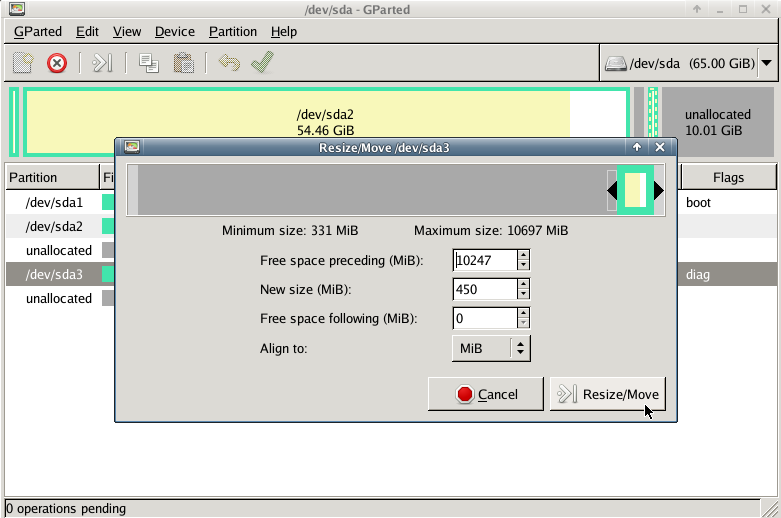
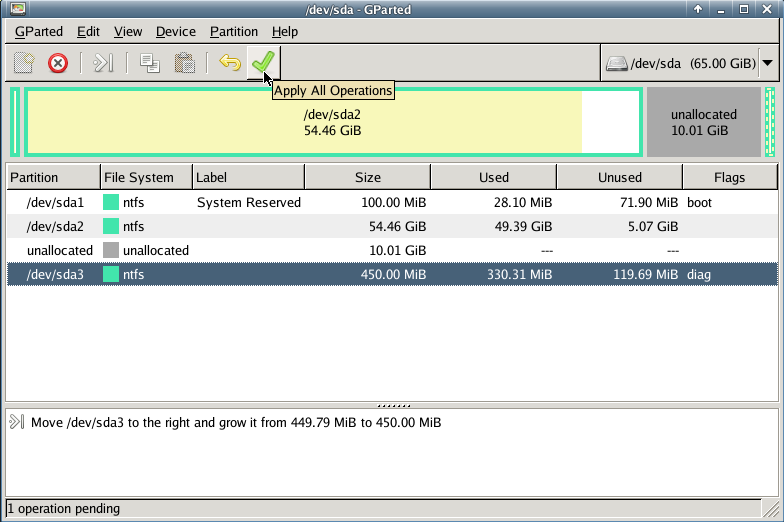
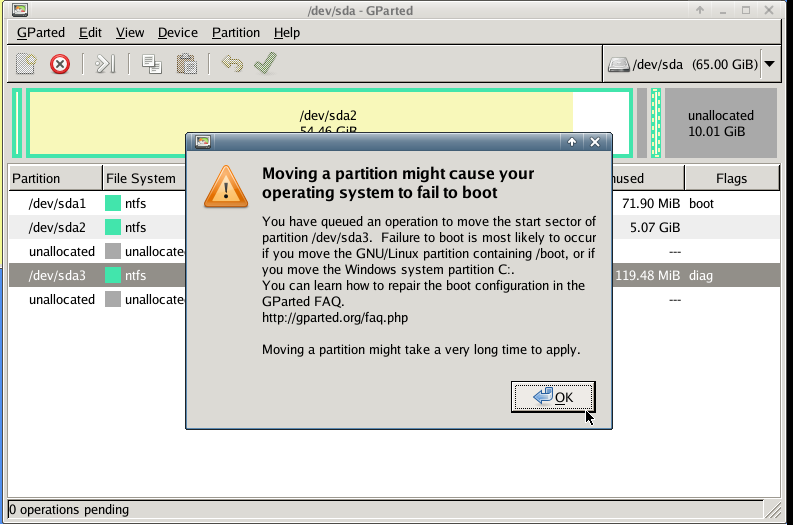
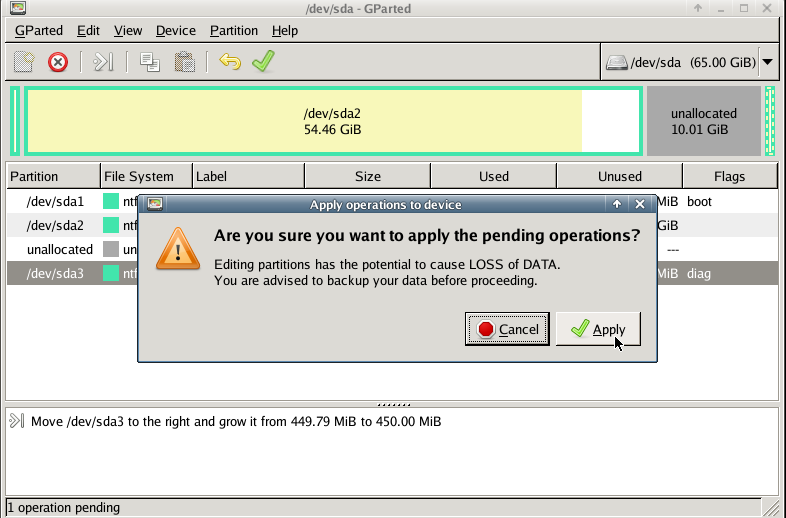
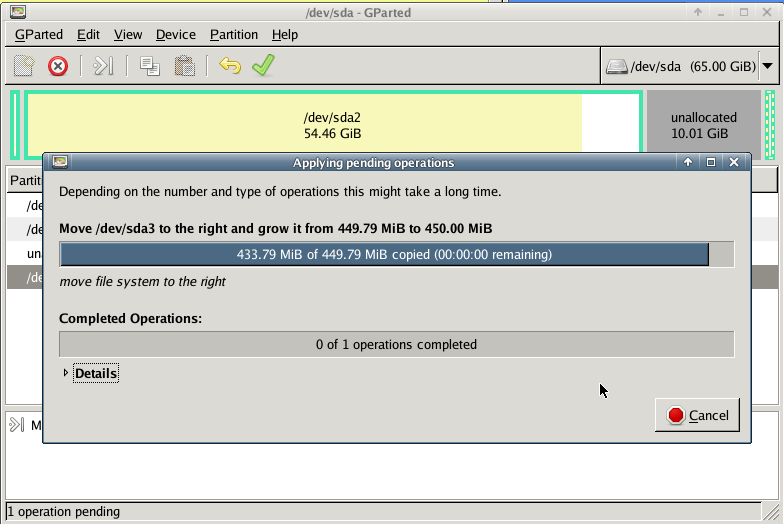
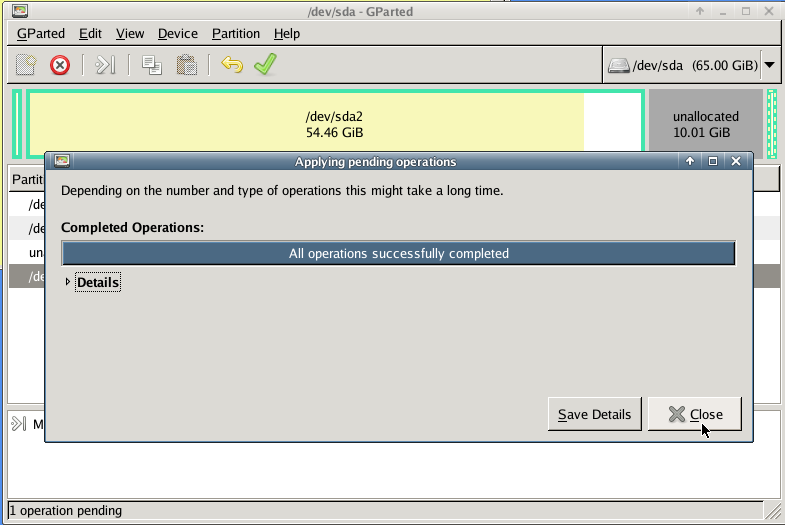
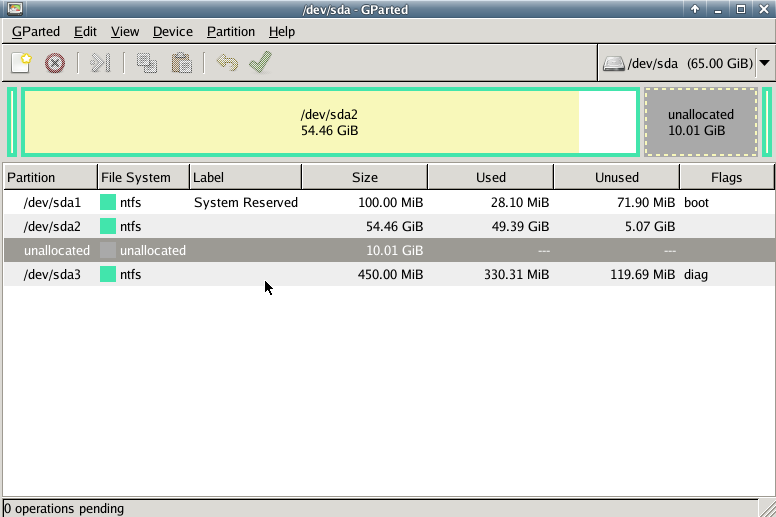
Computer Management - Disk Management
It’s time to extend our partition:
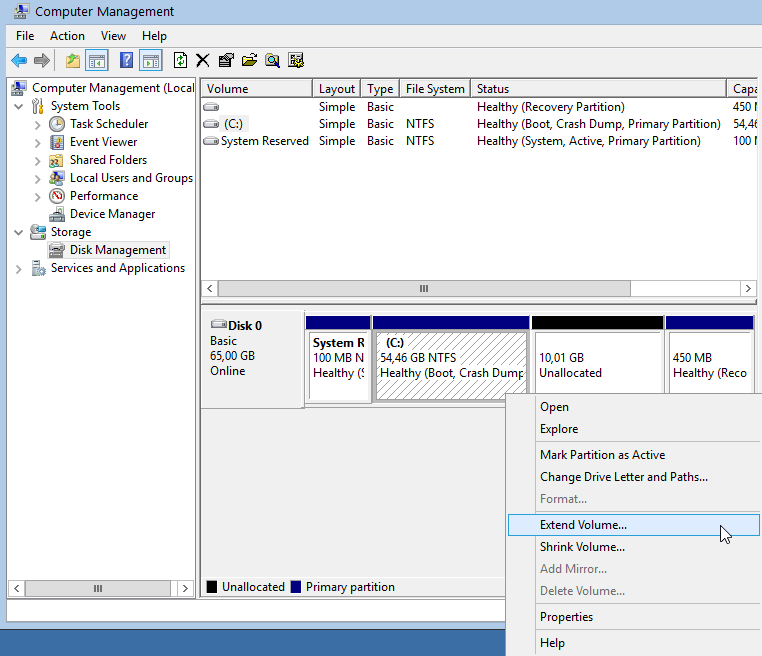
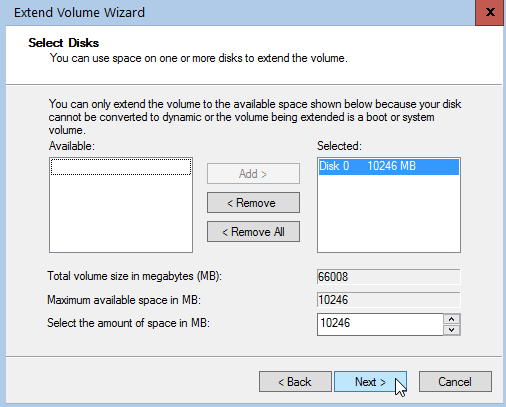
Finish