Elasticsearch, Logstash, Kibana or ELK Crash Course 101
Prologue aka Disclaimer
This blog post is the outcome of a Hackerspace Event:: Logstash Intro Course that happened a few days ago. I prefer doing workshops Vs presentations -as I pray to the Live-Coding Gods- and this is the actual workshop in bulletin notes.
Objectives
For our technical goal we will use my fail2ban !
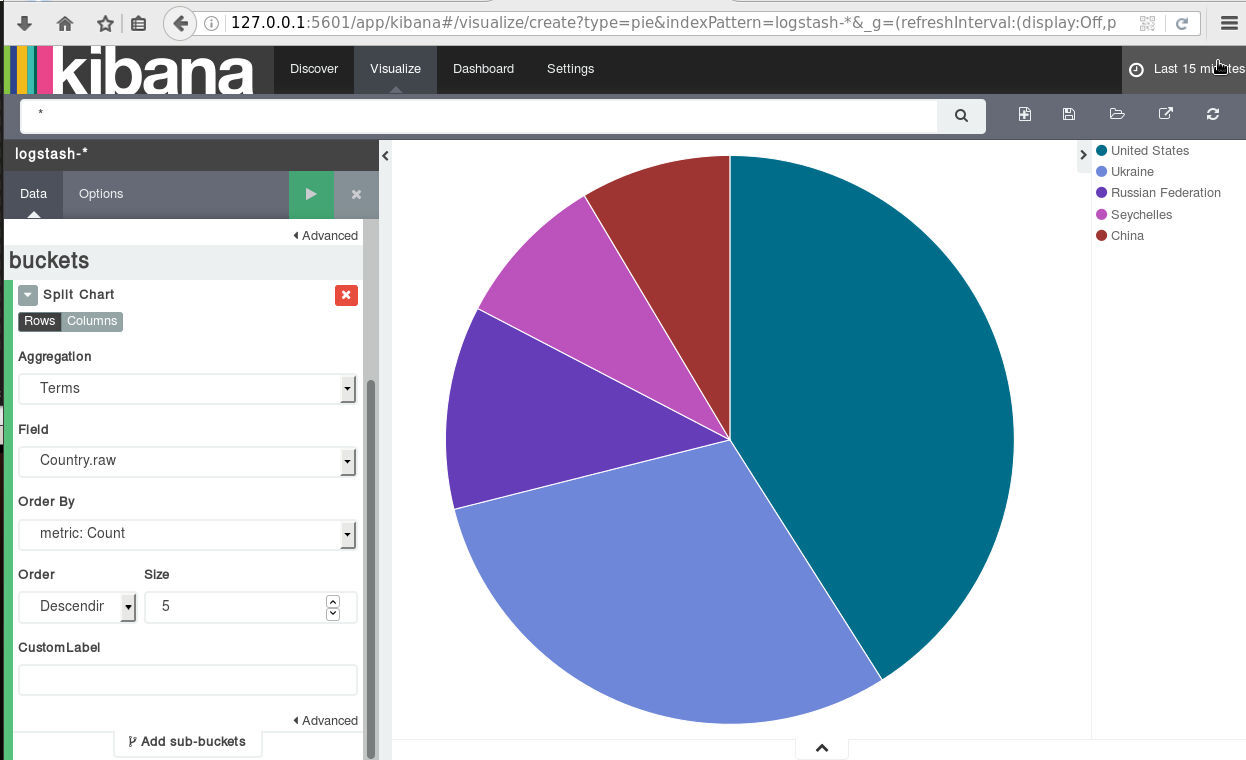
We will figure (together) whom I ban with my fail2ban!!!
The results we want to present are:
| Date | IP | Country |
|---|
To help you with this inquiry, we will use this dataset: fail2ban.gz
If you read though this log you will see that it’s a grep from my messages logs.
So in the begging we have messages from compressed files … and in the end we have messages from uncompressed files.
But … Let’s begin with our journey !!
Prerequisite
For our little experiment we need Java
I Know, I know … not the beverage - the programming language !!
try java 1.7.x
# java -version
java version "1.7.0_111"
OpenJDK Runtime Environment (IcedTea 2.6.7) (Arch Linux build 7.u111_2.6.7-1-x86_64)
OpenJDK 64-Bit Server VM (build 24.111-b01, mixed mode)
In my archlinux machine:
# yes | pacman -S jdk7-openjdkVersions
As, October 26, 2016 all versions (logstash,elastic,kibana) are all in version 5.0.x and latests.
But we will try the well-known installed previous versions !!!
as from 5.0.x and later …. we have: Breaking changes and you will need Java 8
Download
Let’s download software
# wget -c https://download.elastic.co/logstash/logstash/logstash-2.4.1.zip

# wget -c https://download.elastic.co/elasticsearch/elasticsearch/elasticsearch-2.4.1.zip

# wget -c https://download.elastic.co/kibana/kibana/kibana-4.6.3-linux-x86_64.tar.gz
Logstash
Uncompress and test that logstash can run without a problem:
# unzip logstash-2.4.1.zip
# cd logstash-2.4.1

# logstash-2.4.1/
# ./bin/logstash --version
logstash 2.4.1

# ./bin/logstash --help
Basic Logstash Example
Reminder: Ctrl+c breaks the logstash
# ./bin/logstash -e 'input { stdin { } } output { stdout {} }'
We are now ready to type ‘Whatever’ and see what happens:
# ./bin/logstash -e 'input { stdin { } } output { stdout {} }'
Settings: Default pipeline workers: 4
Pipeline main started
whatever
2016-11-15T19:18:09.638Z myhomepc whatever
Ctrl + c
Ctrl + c
^CSIGINT received. Shutting down the agent. {:level=>:warn}
stopping pipeline {:id=>"main"}
Received shutdown signal, but pipeline is still waiting for in-flight events
to be processed. Sending another ^C will force quit Logstash, but this may cause
data loss. {:level=>:warn}
^CSIGINT received. Terminating immediately.. {:level=>:fatal}
Standard Input and Standard Output
In this first example the input is our standard input, that means keyboard
and standard output means our display.
We typed:
whateverand logstash reports:
2016-11-15T19:18:09.638Z myhomepc whatever
There are three (3) fields:
- timestamp : 2016-11-15T19:18:09.638Z
- hostname : myhomepc
- message : whatever
Logstash Architecture

Logstash architecture reminds me Von Neumann .
Input --> Process --> Output In Process we have filter plugins and in input pluggins & output plugins we have codec plugins
Codec plugins
We can define the data representation (logs or events) via codec plugins. Most basic codec plugin is: rubydebug
rubydebug
eg. logstash -e ‘input { stdin { } } output { stdout { codec => rubydebug} }’
# ./bin/logstash -e 'input { stdin { } } output { stdout { codec => rubydebug} }'
Settings: Default pipeline workers: 4
Pipeline main started

whatever

{
       "message" => "whatever",
      "@version" => "1",
    "@timestamp" => "2016-11-15T19:40:46.070Z",
          "host" => "myhomepc"
}

^CSIGINT received. Shutting down the agent. {:level=>:warn}
stopping pipeline {:id=>"main"}
^CSIGINT received. Terminating immediately.. {:level=>:fatal}
json
Let’s try the json codec plugin, but now we will try it via a linux pipe:
# echo whatever | ./bin/logstash -e 'input { stdin { } } output { stdout { codec => json }  }'

Settings: Default pipeline workers: 4
Pipeline main started

{"message":"whatever","@version":"1","@timestamp":"2016-11-15T19:48:44.127Z","host":"myhomepc"}

Pipeline main has been shutdown
stopping pipeline {:id=>"main"}
json_lines
# echo -e 'whatever1nwhatever2nn' | ./bin/logstash -e 'input { stdin { } } output { stdout { codec => json_lines }  }'

Settings: Default pipeline workers: 4
Pipeline main started

{"message":"whatever1","@version":"1","@timestamp":"2016-11-15T19:50:12.311Z","host":"myhomepc"}
{"message":"whatever2","@version":"1","@timestamp":"2016-11-15T19:50:12.324Z","host":"myhomepc"}

Pipeline main has been shutdown
stopping pipeline {:id=>"main"}
List of codec
Here is the basic list of codec:
avro
cef
compress_spooler
cloudtrail
cloudfront
collectd
dots
edn_lines
edn
es_bulk
fluent
gzip_lines
graphite
json_lines
json
line
msgpack
multiline
netflow
nmap
oldlogstashjson
plain
rubydebug
s3_plain
Configuration File
It is now very efficient to run everything from the command line, so we will try to move to a configuration file:
logstash.conf
input {
    stdin { }
}

output {
    stdout {
        codec => rubydebug
    }
}
and run the above example once more:
# echo -e 'whatever1nwhatever2' | ./bin/logstash -f logstash.conf

Settings: Default pipeline workers: 4
Pipeline main started

{
       "message" => "whatever1",
      "@version" => "1",
    "@timestamp" => "2016-11-15T19:59:51.146Z",
          "host" => "myhomepc"
}
{
       "message" => "whatever2",
      "@version" => "1",
    "@timestamp" => "2016-11-15T19:59:51.295Z",
          "host" => "myhomepc"
}

Pipeline main has been shutdown
stopping pipeline {:id=>"main"}
Config Test
Every time you need to test your configuration file for syntax check:
./bin/logstash --configtest

Configuration OK
fail2ban - logstash 1st try
Now it’s time to test our fail2ban file against our logstash setup. To avoid the terror of 22k lines, we will test the first 10 lines to see how it works:
# head ../fail2ban | ./bin/logstash -f logstash.conf
Settings: Default pipeline workers: 4
Pipeline main started

{
       "message" => "messages-20160918.gz:Sep 11 09:13:13 myhostname fail2ban.actions[1510]: NOTICE [apache-badbots] Unban 93.175.200.191",
      "@version" => "1",
    "@timestamp" => "2016-11-15T20:10:40.784Z",
          "host" => "myhomepc"
}
{
       "message" => "messages-20160918.gz:Sep 11 09:51:08 myhostname fail2ban.actions[1510]: NOTICE [apache-badbots] Unban 186.125.190.156",
      "@version" => "1",
    "@timestamp" => "2016-11-15T20:10:40.966Z",
          "host" => "myhomepc"
}
{
       "message" => "messages-20160918.gz:Sep 11 11:51:24 myhostname fail2ban.filter[1510]: INFO [apache-badbots] Found 37.49.225.180",
      "@version" => "1",
    "@timestamp" => "2016-11-15T20:10:40.967Z",
          "host" => "myhomepc"
}
{
       "message" => "messages-20160918.gz:Sep 11 11:51:24 myhostname fail2ban.actions[1510]: NOTICE [apache-badbots] Ban 37.49.225.180",
      "@version" => "1",
    "@timestamp" => "2016-11-15T20:10:40.968Z",
          "host" => "myhomepc"
}
{
       "message" => "messages-20160918.gz:Sep 11 14:58:35 myhostname fail2ban.filter[1510]: INFO [postfix-sasl] Found 185.40.4.126",
      "@version" => "1",
    "@timestamp" => "2016-11-15T20:10:40.968Z",
          "host" => "myhomepc"
}
{
       "message" => "messages-20160918.gz:Sep 11 14:58:36 myhostname fail2ban.actions[1510]: NOTICE [postfix-sasl] Ban 185.40.4.126",
      "@version" => "1",
    "@timestamp" => "2016-11-15T20:10:40.969Z",
          "host" => "myhomepc"
}
{
       "message" => "messages-20160918.gz:Sep 11 15:03:08 myhostname fail2ban.filter[1510]: INFO [apache-fakegooglebot] Ignore 66.249.69.88 by command",
      "@version" => "1",
    "@timestamp" => "2016-11-15T20:10:40.970Z",
          "host" => "myhomepc"
}
{
       "message" => "messages-20160918.gz:Sep 11 15:03:08 myhostname fail2ban.filter[1510]: INFO [apache-fakegooglebot] Ignore 66.249.76.55 by command",
      "@version" => "1",
    "@timestamp" => "2016-11-15T20:10:40.970Z",
          "host" => "myhomepc"
}
{
       "message" => "messages-20160918.gz:Sep 11 15:26:04 myhostname fail2ban.filter[1510]: INFO [apache-fakegooglebot] Ignore 66.249.76.53 by command",
      "@version" => "1",
    "@timestamp" => "2016-11-15T20:10:40.971Z",
          "host" => "myhomepc"
}
{
       "message" => "messages-20160918.gz:Sep 11 17:01:02 myhostname fail2ban.filter[1510]: INFO [apache-badbots] Found 93.175.200.191",
      "@version" => "1",
    "@timestamp" => "2016-11-15T20:10:40.971Z",
          "host" => "myhomepc"
}

Pipeline main has been shutdown
stopping pipeline {:id=>"main"}
fail2ban - filter
As we said in the begging of our journey, we want to check what IPs I Ban with fail2ban !!
So we need to filter the messages. Reading through our dataset, we will soon find out that we need lines like:
"messages-20160918.gz:Sep 11 11:51:24 myhostname fail2ban.actions[1510]: NOTICE [apache-badbots] Ban 37.49.225.180"so we could use an if-statement (conditional statements).
fail2ban - Conditionals
You can use the following comparison operators:

    equality: ==, !=, <, >, <=, >=
    regexp: =~, !~ (checks a pattern on the right against a string value on the left)
    inclusion: in, not in

The supported boolean operators are:

    and, or, nand, xor

The supported unary operators are:

    !

Expressions can be long and complex.
fail2ban - message filter
With the above knowledge, our logstash configuration file can now be:
logstash.conf
input {
    stdin { }
}

filter {
    if [message]  !~ ' Ban ' {
        drop { }
    }
}

output {
    stdout {
        codec => rubydebug
    }
}
and the results:
# head ../fail2ban | ./bin/logstash -f logstash.conf -v

{
       "message" => "messages-20160918.gz:Sep 11 11:51:24 myhostname fail2ban.actions[1510]: NOTICE [apache-badbots] Ban 37.49.225.180",
      "@version" => "1",
    "@timestamp" => "2016-11-15T20:33:39.858Z",
          "host" => "myhomepc"
}
{
       "message" => "messages-20160918.gz:Sep 11 14:58:36 myhostname fail2ban.actions[1510]: NOTICE [postfix-sasl] Ban 185.40.4.126",
      "@version" => "1",
    "@timestamp" => "2016-11-15T20:33:39.859Z",
          "host" => "myhomepc"
}
but we are pretty far away from our goal.
The above approach is just fine for our example, but it is far away from perfect or even elegant !
And here is way: the regular expression ‘ Ban ‘ is just that, a regular expression.
The most elegant approach is to match the entire message and drop everything else. Then we could be most certain sure about the output of the logs.
grok
And here comes grok !!!
and to do that we must learn the grok:
Parses unstructured event data into fieldsthat would be extremely useful. Remember, we have a goal!
We dont need everything, we need the date, ip & country !!
Grok Patterns
grok work with patterns, that follows the below generic rule:
%{SYNTAX:SEMANTIC}
You can use the online grok debugger: grok heroku
to test your messages/logs/events against grok patterns
If you click on the left grok-patterns you will see the most common grok patterns.
In our setup:
# find . -type d -name patterns
./vendor/bundle/jruby/1.9/gems/logstash-patterns-core-2.0.5/lib/logstash/patterns
./vendor/bundle/jruby/1.9/gems/logstash-patterns-core-2.0.5/patterns
the latest directory is where our logstansh instance keeps the default grok patterns.
To avoid the suspense … here is the full grok pattern:
messages%{DATA}:%{SYSLOGTIMESTAMP} %{HOSTNAME} %{SYSLOGPROG}: %{LOGLEVEL} [%{PROG}] Ban %{IPV4}grok - match
If you run this new setup, we will see something peculiar:
logstash.conf
input {
    stdin { }
}

filter {

#    if [message]  !~ ' Ban ' {
#        drop { }
#    }

    grok {
        match => {
            "message" => "messages%{DATA}:%{SYSLOGTIMESTAMP} %{HOSTNAME} %{SYSLOGPROG}: %{LOGLEVEL} [%{PROG}] Ban %{IPV4}"
        }
    }
}

output {
    stdout {
        codec => rubydebug
    }
}
We will get messages like these:
{
       "message" => "messages:Nov 15 17:49:09 myhostname fail2ban.actions[1585]: NOTICE [apache-fakegooglebot] Ban 66.249.76.67",
      "@version" => "1",
    "@timestamp" => "2016-11-15T21:30:29.345Z",
          "host" => "myhomepc",
       "program" => "fail2ban.actions",
           "pid" => "1585"
}
{
       "message" => "messages:Nov 15 17:49:31 myhostname fail2ban.action[1585]: ERROR /etc/fail2ban/filter.d/ignorecommands/apache-fakegooglebot 66.249.76.104 -- stdout: ''",
      "@version" => "1",
    "@timestamp" => "2016-11-15T21:30:29.346Z",
          "host" => "myhomepc",
          "tags" => [
        [0] "_grokparsefailure"
    ]
}
It match some of them and the all the rest are tagged with grokparsefailure
We can remove them easily:
logstash.conf
input {
    stdin { }
}

filter {

#    if [message]  !~ ' Ban ' {
#        drop { }
#    }

    grok {
        match => {
            "message" => "messages%{DATA}:%{SYSLOGTIMESTAMP} %{HOSTNAME} %{SYSLOGPROG}: %{LOGLEVEL} [%{PROG}] Ban %{IPV4}"
        }
    }

    if "_grokparsefailure" in [tags] {
        drop { }
    }
}

output {
    stdout {
        codec => rubydebug
    }
}
Using colon (:) character on SYNTAX grok pattern is a new field for grok / logstash.
So we can change a little bit the above grok pattern to this:
messages%{DATA}:%{SYSLOGTIMESTAMP} %{HOSTNAME} %{PROG}(?:[%{POSINT}])?: %{LOGLEVEL} [%{PROG}] Ban %{IPV4}but then again, we want to filter some fields, like the date and IP, so
messages%{DATA}:%{SYSLOGTIMESTAMP:date} %{HOSTNAME} %{PROG}(?:[%{POSINT}])?: %{LOGLEVEL} [%{PROG}] Ban %{IPV4:ip}logstash.conf
input {
    stdin { }
}

filter {

#    if [message]  !~ ' Ban ' {
#        drop { }
#    }

    grok {
        match => {
            "message" => "messages%{DATA}:%{SYSLOGTIMESTAMP:date} %{HOSTNAME} %{PROG}(?:[%{POSINT}])?: %{LOGLEVEL} [%{PROG}] Ban %{IPV4:ip}"
        }
    }

    if "_grokparsefailure" in [tags] {
        drop { }
    }
}

output {
    stdout {
        codec => rubydebug
    }
}
output will be like this:
       "message" => "messages:Nov 15 17:49:32 myhostname fail2ban.actions[1585]: NOTICE [apache-fakegooglebot] Ban 66.249.76.104",
      "@version" => "1",
    "@timestamp" => "2016-11-15T21:42:21.260Z",
          "host" => "myhomepc",
          "date" => "Nov 15 17:49:32",
            "ip" => "66.249.76.104"
}
grok - custom pattern
If we want to match something specific with to a custom grok pattern, we can simple add one!
For example, we want to match Ban and Unban action:
# vim ./vendor/bundle/jruby/1.9/gems/logstash-patterns-core-2.0.5/patterns/ebalACTION (Ban|Unban)and then our grok matching line will transform to :
logstash.conf
input {
    stdin { }
}

filter {

#    if [message]  !~ ' Ban ' {
#        drop { }
#    }

    grok {
        match => {
#            "message" => "messages%{DATA}:%{SYSLOGTIMESTAMP:date} %{HOSTNAME} %{PROG}(?:[%{POSINT}])?: %{LOGLEVEL} [%{PROG}] Ban %{IPV4:ip}"
            "message" => "messages%{DATA}:%{SYSLOGTIMESTAMP:date} %{HOSTNAME} %{PROG}(?:[%{POSINT}])?: %{LOGLEVEL} [%{PROG}] %{ACTION:action} %{IPV4:ip}"
        }
    }

    if "_grokparsefailure" in [tags] {
        drop { }
    }
}

output {
    stdout {
        codec => rubydebug
    }
}
output:
{
       "message" => "messages:Nov 15 18:13:53 myhostname fail2ban.actions[1585]: NOTICE [apache-badbots] Unban 41.82.165.220",
      "@version" => "1",
    "@timestamp" => "2016-11-15T21:53:59.634Z",
          "host" => "myhomepc",
          "date" => "Nov 15 18:13:53",
        "action" => "Unban",
            "ip" => "41.82.165.220"
}
mutate
We are getting pretty close … the most difficult part is over (grok patterns).
Just need to remove any exta fields. We can actually do that with two ways:
- grok - remove_field
- mutate -remove_field
We’ll try mutate cause is more powerful.
And for our example/goal we will not use any custom extra Action field, so:
logstash.conf
input {
    stdin { }
}

filter {

#    if [message]  !~ ' Ban ' {
#        drop { }
#    }

    grok {
        match => {
            "message" => "messages%{DATA}:%{SYSLOGTIMESTAMP:date} %{HOSTNAME} %{PROG}(?:[%{POSINT}])?: %{LOGLEVEL} [%{PROG}] Ban %{IPV4:ip}"
#            "message" => "messages%{DATA}:%{SYSLOGTIMESTAMP:date} %{HOSTNAME} %{PROG}(?:[%{POSINT}])?: %{LOGLEVEL} [%{PROG}] %{ACTION:action} %{IPV4:ip}"
        }
    }

    if "_grokparsefailure" in [tags] {
        drop { }
    }
    mutate {
        remove_field => [ "message", "@version", "@timestamp", "host" ]
    }
}

output {
    stdout {
        codec => rubydebug
    }
}
results:
{
    "date" => "Nov 15 17:49:32",
      "ip" => "66.249.76.104"
}
so close !!!
mutate - replace
According to syslog RFC (request for comments) [RFC 3164 - RFC 3195]:
In particular, the timestamp has a year, making it a nonstandard formatso most of logs doesnt have a YEAR on their timestamp !!!
Logstash can add an extra field or replace an existing field :
logstash.conf
input {
    stdin { }
}

filter {

#    if [message]  !~ ' Ban ' {
#        drop { }
#    }

    grok {
        match => {
            "message" => "messages%{DATA}:%{SYSLOGTIMESTAMP:date} %{HOSTNAME} %{PROG}(?:[%{POSINT}])?: %{LOGLEVEL} [%{PROG}] Ban %{IPV4:ip}"
#            "message" => "messages%{DATA}:%{SYSLOGTIMESTAMP:date} %{HOSTNAME} %{PROG}(?:[%{POSINT}])?: %{LOGLEVEL} [%{PROG}] %{ACTION:action} %{IPV4:ip}"
        }
    }

    if "_grokparsefailure" in [tags] {
        drop { }
    }
    mutate {
        remove_field => [ "message", "@version", "@timestamp", "host" ]
        replace => { date => "%{+YYYY} %{date}" }
    }
}

output {
    stdout {
        codec => rubydebug
    }
}
the output:
{
    "date" => "2016 Nov 15 17:49:32",
      "ip" => "66.249.76.104"
}
GeoIP
The only thing that is missing from our original goal, is the country field!
Logstash has a geoip plugin that works perfectly with MaxMind
So we need to download the GeoIP database:
# wget -N http://geolite.maxmind.com/download/geoip/database/GeoLiteCountry/GeoIP.dat.gz
The best place is to put this file (uncompressed) under your logstash directory.
Now, it’s time to add the geoip support to the logstash.conf :
  # Add Country Name
  # wget -N http://geolite.maxmind.com/download/geoip/database/GeoLiteCountry/GeoIP.dat.gz
  geoip {
    source => "ip"
    target => "geoip"
    fields => ["country_name"]
    database => "GeoIP.dat"
   # database => "/etc/logstash/GeoIP.dat"
  }
the above goes under the filter section of logstash conf file.
running the above configuration
# head ../fail2ban | ./bin/logstash -f logstash.confshould display something like this:
{
     "date" => "2016 Sep 11 11:51:24",
       "ip" => "37.49.225.180",
    "geoip" => {
        "country_name" => "Netherlands"
    }
}
{
     "date" => "2016 Sep 11 14:58:36",
       "ip" => "185.40.4.126",
    "geoip" => {
        "country_name" => "Russian Federation"
    }
}
We are now pretty close to our primary objective.
rename
It would be nice to somehow translate the geoip –> country_name to something more useful, like Country.
That’s why we are going to use the rename setting under the mutate plugin:
  mutate {
    rename => { "[geoip][country_name]"  => "Country" }
  }
so let’s put all them together:
    geoip {
        source => "ip"
        target => "geoip"
        fields => ["country_name"]
        database => "GeoIP.dat"
    }

    mutate {
        rename => { "[geoip][country_name]"  => "Country" }
        remove_field => [ "message", "@version", "@timestamp", "host", "geoip"]
        replace => { date => "%{+YYYY} %{date}" }
    }
test run it and the output will show you something like that:
{
       "date" => "2016 Sep 11 11:51:24",
         "ip" => "37.49.225.180",
    "Country" => "Netherlands"
}
{
       "date" => "2016 Sep 11 14:58:36",
         "ip" => "185.40.4.126",
    "Country" => "Russian Federation"
}
hurray !!!
finally we have completed our primary objective.
Input - Output
Input File
Until now, you have been reading from the standard input, but it’s time to read from the file.
To do so, we must add the bellow settings under the input section:
file {
    path => "/var/log/messages"
    start_position => "beginning"
}
Testing our configuration file (without giving input from the command line):
./bin/logstash -f logstash.conf
and the output will be something like this:
{
       "path" => "/var/log/messages",
       "date" => "2016 Nov 15 17:49:09",
         "ip" => "66.249.76.67",
    "Country" => "United States"
}
{
       "path" => "/var/log/messages",
       "date" => "2016 Nov 15 17:49:32",
         "ip" => "66.249.76.104",
    "Country" => "United States"
}
so by changing the input from the standard input to a file path, we added a new extra filed.
The path
Just remove it with mutate –> remove_field as we already shown above
Output
Now it’s time to send everything to our elastic search engine:
output {

    # stdout {
    #    codec => rubydebug
    # }

    elasticsearch {
    }

}
Be Careful: In our above examples we have removed the timestamp field
but for the elasticsearch to work, we must enable it again:
remove_field => [ "message", "@version", "host", "geoip"]Elasticsearch
Uncompress and run elastic search engine:
# unzip elasticsearch-2.4.1.zip
# cd elasticsearch-2.4.1/
# ./bin/elasticsearch
elasticsearch is running under:
tcp6       0      0 127.0.0.1:9200          :::*                    LISTEN      27862/java
tcp6       0      0 127.0.0.1:9300          :::*                    LISTEN      27862/java
Impressive, but that’s it!
Status
Let’s find out if the elasticsearch engine is running:
$ curl 'localhost:9200/_cat/health?v'

$ curl -XGET 'http://localhost:9200/_cluster/health?pretty=true'

epoch      timestamp cluster       status node.total node.data shards pri relo init unassign pending_tasks max_task_wait_time active_shards_percent
1482421814 17:50:14  elasticsearch yellow          1         1      1   1    0    0        1             0                  -                 50.0%

$ curl 'localhost:9200/_cat/nodes?v'

host      ip        heap.percent ram.percent load node.role master name
127.0.0.1 127.0.0.1            7          98 0.50 d         *      Hazmat

# curl -s -XGET 'http://localhost:9200/_cluster/health?level=indices' | jq .
logstash
Now it’s time to send our data to our elastic search engine, running the logstash daemon with input the fail2ban file and output the elastic search.
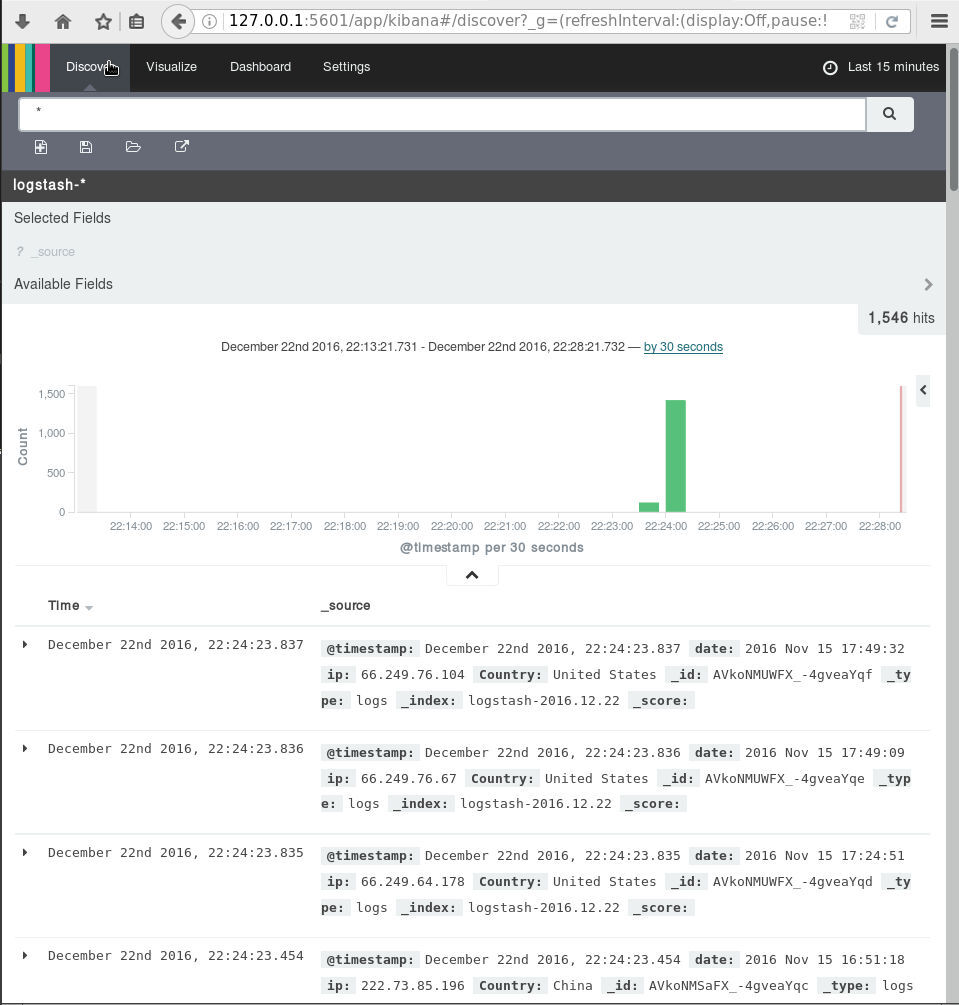
Kibana
We are almost done. There is only one more step to our 101 course for ELK infrastructure.
And that is the kibana dashboard.
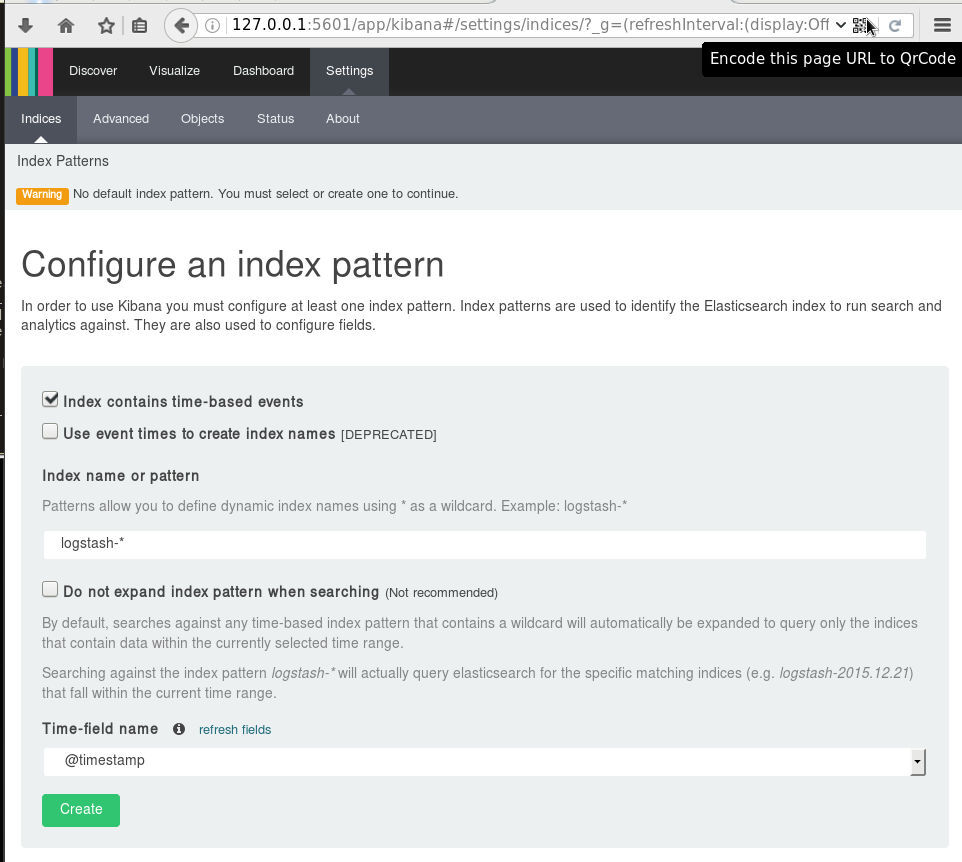
setup kibana
Uncompress and run the kibana dashboard:
 tar xf kibana-4.6.3-linux-x86_64.tar.gz
 ./bin/kibana
dashboard
Now simply, open the kibana dashboard on: